Curated OER
Linear and Exponential Models
Students investigate the differences between linear and exponential models. In this linear and exponential models lesson, students make a table of given data. Students determine if the data is linear or exponential by plotting the data...
Kenan Fellows
Lego Thinking and Building
Run a simulated airplane manufacturing plant with your pupils as the builders! Learners build Lego airplane models and collect data on the rate of production, comparing the number produced to the number defective. Using linear...
Curated OER
How's The Weather?
Students make a box and whiskers plot using the TI-73 graphing calculator. Each student would have their own calculator but they would work in small groups of two or three to help each other enter the data and make the plots.
Curated OER
Test On Analytic Geometry/ Play Green Globs
Students engage in a lesson plan that focuses on analytic geometry. The lesson plan asked them to apply skills of relating equations when plotting them on the coordinate plane. Students construct the equations using specific criteria and...
Curated OER
Handy Reflections
Learners explore reflections on a coordinate plane in this lesson plan. They trace their hand on a grid, determine the coordinates of each point, and create a scatter plot of their points. Pupils use this information to investigate...
Curated OER
Histograms and Statistical Graphics
In this statistics worksheet, students solve 6 data problems. They construct a histogram of given data, they create a frequency polygon, and a stem and leaf diagram. Students create a dot plot and a pie chart for given data sets. On the...
Curated OER
Getting A Grip On Graphs
Fourth graders investigate the concept of graphing and comparing different types of data using pictographs, line graphs, scatter plots, etc... They gather data and make interpretations while examining the medium of how it is displayed.
Curated OER
Scientific Observation of Force and Acceleration on an Object
In this force and acceleration worksheet, 8th graders answer ten questions based on two graphs. The first graph is a scatter plot, the second is a line graph.
Curated OER
Algebra 2 - Linear Programming
Students read real world problems, determine the variables, and set up the function using algebraic statements. After entering data into the graphing calculator, they display information in the form of graphs and scatter plots. ...
Curated OER
Statistical Diagrams
In this statistics worksheet, students explore five activities that require analysis and interpretation of maps, charts, and scatter plots. The six page lesson includes five activities or experiments with short answer questions. ...
Curated OER
VARIABLES AND PATTERNS, USE AFTER INVESTIGATION THREE. DISCRETE OR CONTINUOUS LINEAR RELATIONS.
Students discover for which kind of linear function is appropriate to use the "scatter" or the "connected" term. In this lesson, students investigate functions using variables, patterns book, graph paper, rulers and the graphit program.
Curated OER
Investigating Correlation
High schoolers investigate different types of correlation in this statistics instructional activity. They identify positive, negative and no correlation as it relates to their data. They then find the line of best fit for the plotted data.
Curated OER
Graphs
In this graphs worksheet, students solve and complete 9 various types of problems. First, they use a large scatter graph to complete a described trend in data. Then, students find the difference of negative numbers and place them in...
Curated OER
Exploring Diameter and Circumference
Learn how to identify the diameter and circumference of a circle. Then, collect data on a circle and relate it to the diameter and circumference of a circle. Last, plot data and find the line of best fit.
Curated OER
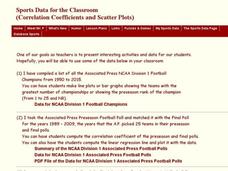
Sports Data for the Classroom
In this algebra activity,students rewrite word problems using algebraic expressions. They collect data and plot their findings on the graph and analyze it. There is an answer key for this activity.
Curated OER
Graphs
Students explore graphs and define the different ways they are used to display data. In this algebra lesson, students collect data and plot their data using the correct graph. They draw conclusions from their graphs based on their data.
Virginia Department of Education
Exponential Modeling
Investigate exponential growth and decay. A set of six activities has pupils collecting and researching data in a variety of situations involving exponential relationships. They model these situations with exponential functions and solve...
Flipped Math
Unit 1 Review: Analyze Graphs and Expressions
Get in one last practice. Pupils work through 12 problems and a performance task to review the topics in Unit 1. The problems cover analyzing and modeling with graphs, algebraic properties of equality, and adding, subtracting, and...
Virginia Department of Education
How Much is that Tune?
Tune in for savings! Scholars investigate pricing schemes for two different online music download sites. After comparing the two, they determine the numbers of songs for which each site would be cheaper.
Virginia Department of Education
Linear Modeling
An inquiry-based algebra lesson plan explores real-world applications of linear functions. Scholars investigate four different situations that can be modeled by linear functions, identifying the rate of change, as well as the strength...
Curated OER
A Plop and Fizz
Seventh graders perform an experiment to determine the effect of temperature on reaction rates. In this chemistry lesson plan, 7th graders take measurements and record data. They create a graph and analyze results.
Curated OER
Investigating Linear Equations Using Graphing Calculator
Learners investigate linear equations using the Ti-Calculator. In this algebra lesson, students graph lines and identify the different quadrants on a coordinate plane. They identify ordered pairs used to plot lines.
Curated OER
Black Out
Pupils collect and analyze data. In this statistics lesson, students plot their data on a coordinate plane and find the line of best fit. They calculate the linear regression using the data.
Curated OER
Ornithology and Real World Science
Double click that mouse because you just found an amazing lesson! This cross-curricular Ornithology lesson incorporates literature, writing, reading informational text, data collection, scientific inquiry, Internet research, art, and...


