Curated OER
Making Math Meaningful in March Madness
Middle schoolers examine the statistics of March Madness, the college basketball tournament. They watch videotaped basketball games to collect data for further analysis using Word and Excel. They analyze the data in a variety of...
Curated OER
Math Game Night
Young scholars plan a family game night. In this problem solving lesson, students brainstorm games to play, watch a video to help with room arrangement and determine which room arrangement would work best. When all the preparations are...
Curated OER
Problem Solving Using Percentages
Students explore the concept of percentages. In this percentages lesson, students find the percentages of various colored m&m's in their bags. Students find the cost of items before and after a discount. Students use proportions to...
Curated OER
Problem-Solving Strategy: Act It Out
For this mathematics worksheet, 1st graders identify what time the concert starts and ends. Then they use a clock to act out the time and draw the hands on the clock to show when the concert will be over.
Curated OER
High School Examination: Algebra 2/Trigonometry
For this high school worksheet, students solve problems involving angles, functions, square roots, and sequences. They read word problems, write equations, and then solve them. This 28-page worksheet contains 39 problems.
Curated OER
Math Name Tag: An Introduction Project for the First Day
Eighth graders introduce themselves to the class by using a creative display of magazine cutouts, pictures, and drawings on a math symbol that represents who they are.
Curated OER
Partial Products
Students use the partial products algorithm to complete multiplication problems. In this partial products lesson plan, students are introduced to the algorithm and connect the relationship to multiplication and division problems.
Curated OER
Solving Multiple-Step Problems
Students solve 2-step word problems. In this word problems instructional activity, students are shown examples of word problems and solutions on the board by the teacher. Then they complete a six problem worksheet independently.
Curated OER
Pay Day!
Young scholars apply mathematical skills to solve problems using data brought in by the Navy speaker. They use critical thinking skills to create their own story problems. Students exchange story problems among young scholars to analyze...
EngageNY
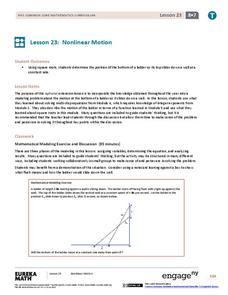
Nonlinear Motion
Investigate nonlinear motion through an analysis using the Pythagorean Theorem. Pupils combine their algebraic and geometric skills in the 24th lesson of this 25-part module. Using the Pythagorean Theorem, scholars collect data on the...
Curated OER
Measurement and Problem Solving
Learners solve problems using a calendar. For this calendar lesson, students complete a worksheet of math story problems. Example problems are provided.
Beacon Learning Center
Bowling Over the Order of Operations
Upper graders will solve equations using order of operations, and create equations that to play a fun math bowling game. They will bowl using dice to practice operations. Extensions are also included.
Curated OER
Four Matrix, Eigenvalue, and Eigenvector Problems
In this matrix worksheet, young scholars solve a system of differential equations, find eigenvalues and eigenvector in two problems, and solve a word problem using a system.
Curated OER
A Family Day Out
Students use all four operations to solve word problems involving money. A story about a family's day trip is included with sample word problems included. They must calculate costs, change, and budgeting. They report their calculations...
EngageNY
Comparing Quantities with Percent
Be 100 percent confident who has the most and by how much. Pupils use percentages to help make the comparisons by finding what percent one quantity is of the other. They also determine the percent differences between the two quantities.
Curated OER
Patterns and Pentominoes
Students solve pentomino puzzles. For this problem solving lesson, students discuss how pentomino puzzles play into the plot of Chasing Vermeer by Blue Balliett and practice solving a pentomino puzzle on their own. Students will...
Curated OER
Compound Inequalities and Graphing
Put geometry skills to the test! Learners solve compound inequalities and then graph the inequalities on a coordinate plane using their geometric skills. They identify the slope and y-intercept in order to graph correctly. I like this...
Curated OER
Graphing Systems of Inequalities
Solve equations and graph systems of inequalities. Designed as a lesson to reinforce these concepts, learners revisit shading and boundaries along with solving linear inequalities.
CPM
Direct, Joint, and Inverse Variation
Here is a quick guide to direct, joint, and inverse variation used in realistic situations. Each topic has a page of notes and examples followed by practice problems. The resource explains each type of variation and provides their...
EngageNY
Interpreting and Computing Division of a Fraction by a Fraction—More Models II
No more inverting and multiplying to divide fractions. Applying concepts of measurement division from the previous lesson plan, pupils consider partitive division using fraction bars and number lines. They first convert fractions to like...
Curated OER
Going Graph-y
Second graders listen to and dicuss the story Where the Wild Things Are. They play a pantomime game and act out various feelings so their classmates can guess. They listen for the frequency of certain words, and record their findings on...
Curated OER
Fractions in Action
Investigate equivalent fractions with your class. They compare and order fractions. Then they work cooperatively in groups to experiment and problem solve with fractions using a game format. Multiple resources are provided.
Curated OER
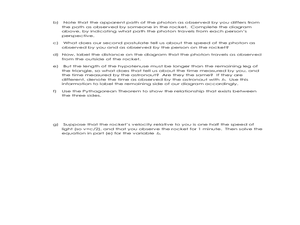
Time Dilation and Geometry
Students solve problems of dilation and velocity. In this geometry lesson, students apply the Pythagorean Theorem to solve problems and relate it to time and velocity.
American Statistical Association
Scatter It! (Using Census Results to Help Predict Melissa’s Height)
Pupils use the provided census data to guess the future height of a child. They organize and plot the data, solve for the line of best fit, and determine the likely height and range for a specific age.


