Curated OER
It's a Drag!
Students create number lines using decimals and whole numbers. In this algebra lesson, students graph and solve linear equations. They plot ordered pairs on a coordinate plane correctly.
Curated OER
Misleading Graphs
Students explore number relationships by participating in a data collection activity. In this statistics instructional activity, students participate in a role-play activitiy in which they own a scrap material storefront that must...
Curated OER
Venn Diagram
Young scholars classify items and numbers by using a Venn diagram. In this Venn diagram lesson plan, students use the computer to do this and classify pictures and numbers.
Curated OER
Order of Operations
Sixth graders perform the Order of Operations. Given various story problems, groups of students solve equations requiring division, multiplication, parenthesis, exponents and other mathematical processes. They discuss the order of...
Curated OER
Understanding Place Value
Fifth graders study place value. After forming teams, they play a game called, "Who Can Line Up the Number." Students observe numbers in expanded form and place representative digits in the correct order.
Curated OER
Cubic Unit Models
Fourth graders find the volume of solids. In groups, 4th graders use spinners to determine the dimensions of solids. They construct the shapes, creating a model of the figure Students count the cubes in the model to determine the...
Curated OER
One Hundred Hungry Ants
Primaries read the book One Hundred Hungry Ants and solve word problems based on the book. In this word problems lesson plan, students will be able to find the factors of a number by organizing counters into equal rows.
Curated OER
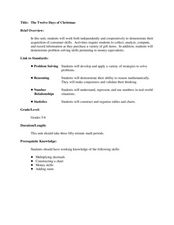
The Twelve Days of Christmas
Students purchase gift items and practice collecting, analyzing, computing, and recording information. In this data lesson plan, students also complete money equivalent activities.
Curated OER
Playing With Probability
Students rotate through work stations where they compute problems of theoretical and experimental probability. In this probability lesson plan, students use simulations of a lottery system.
Curated OER
One, Two, Three...and They're Off
Students make origami frogs to race. After the race they measure the distance raced, collect the data, enter it into a chart. They then find the mean, median, and mode of the data. Next, students enter this data into Excel at which time...
Curated OER
Survey and Tally
Second graders view a model of a survey and tally. In this survey and tally lesson plan, 2nd graders decide on questions for a survey. Students conduct the survey and tally their results. Students create a tally chart. Students view a...
Curated OER
Function Machine
Second graders decipher a pattern using input and output. In this functions lesson, 2nd graders use input and output numbers to find a pattern involving addition and subtraction. Students use the pattern they discovered to help solve...
Curated OER
Wiggle Worms
First graders investigate worms, collect and analyze data. In this worm and data lesson, 1st graders listen to Chick and Duckling from the Macmillan/McGraw-Hill reading series. They conduct experiments with worms, collect simple data,...
Curated OER
Graphing
Learners investigate graphing. In this bar graph lesson, students view an informational website about graphing, then construct a class birthday bar graph outside with sidewalk chalk. Learners choose a survey topic, then collect data and...
Curated OER
Halloween Word Problems
Young mathematicians are put to the test in a worksheet that requires them to help another school plan a Halloween party. By reading word problems, learners decide whether to multiply or divide in order to solve.
Curated OER
Being Thrifty is So Nifty
Students watch a video that focusing on budgeting while completing worksheets that include charts. They brainstorm ideas for budgeting time and money. They culminate the activity by planning an order from two different restaurants.
Curated OER
Bunny Cakes and Graphing
Third graders graph and analyze data relating to the book "Bunny Cakes" by Rosemary Wells. They listen to and discuss the book, vote on their favorite cake using Excel computer software, and discuss the results.
Curated OER
Bar Graphs
Third graders investigate bar graphs. In this third grade mathematics lesson, 3rd graders collect and analyze data and use the internet’s Graph challenge to create their own graphs. Students write questions for the other students to...
Curated OER
Graphing
Learners collect data to create different types of graphs-line, pie, and bar graphs. They use StarOffice 6.0 to create graphs.
Curated OER
Filling the Glass (Water, Air, and Fractions)
Students predict which of two glasses is 1/2 full using visual estimation, height measurement, and liquid measurement methods. Mathematical equations to accurately solve the problem are determined and verified.
Curated OER
Archaeology: Digging in the Classroom
Students explore how an archaeologist works and makes discoveries. In this archaeology lesson, students participate in a simulation in which they excavate broken pottery. Students use measurement, geometry, and observation skills during...
Curated OER
The Evolution of Arkansas Elementary Education
Fourth graders interview older citizens to discover earlier educational history. They write essays based on their interviews.
Curated OER
Show Me!
Students analyze and interpret graphs. In this graphing lesson, students view a video and construct their own graphs (line, circle, bar) from given sets of data.


