Curated OER
Skittles Lab
Students use Skittles as manipulatives to practice computing decimals from fractions, computing decimals into percentages, and creating bar graphs from gathered data.
Curated OER
Once in a Blue Moon
Third graders identify the phases of the moon. They use technology to access websites on the Internet dealing with the moon.
Curated OER
Ordinals
Students examine uses for ordinal numbers in calendars, and an ordinal chart. They order ice cream cone cut outs from 1st to 20th and complete a worksheet. (not given)
Curated OER
Harry Potter Research Project
Young scholars work together to complete a research project on Harry Potter. They write a research question and develop a survey to give to their classmates. Using the results, they create a graph and draw conclusions about the data...
Curated OER
The Exact Differential
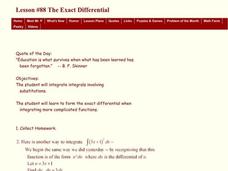
Students integrate functions using u substitution. In this integrating functions using u substitution lesson, students integrate functions by setting part of the function equal to u and the other part equal to du. Students integrate...
Curated OER
Representing Relationships with Equations
Students explore Cuisenaire Rods. In this pre-algebra instructional activity, students work with a partner to generate addition problems with the sum of ten using Cuisenaire Rods. Students construct examples of the Commutative Property...
Curated OER
Our Favorites
Students participate in and conduct a survey to determine various class favorites. They collect, organize and display their data, interpret the results, and complete a packet of worksheets to display the information.
Curated OER
I Can Average Grades Like My Teacher!!!
Fifth graders investigate the mean of a data set. In this fifth grade mathematics lesson, 5th graders determine the mean of sets of numbers using a calculator. Students use a blank role book page to create grades for students and work...
Curated OER
M & Ms in a Bag
Students make predictions about the number and colors of M&M's in a snack size package. They create an Excel spreadsheet to record the data from their small group's bag, create a graph of the data, and discuss the variations of data...
Curated OER
Estimating the Mile Record
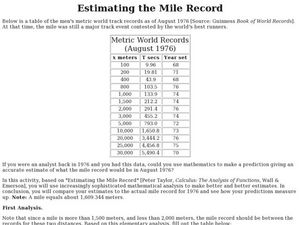
In this estimating the mile record, students examine given data. They use create a box-and-whisker plot to determine the upper and lower quartiles of the data. This one-page activity contains 1 multi-step problems.
Curated OER
Favorite Farm Animals
Students perform a study of farm animals and their babies. They compile a graph of their favorite farm animals. They utilize a spreadsheet worksheet which is imbedded in this plan.
Curated OER
Graphing Our Favorite Candy Bars
Students use ClarisWorks to graph class' favorite candy bars on a bar graph.
Curated OER
Inching Our Way through Measurement
Students review how to use an inch ruler and listen to the story, Inch by Inch by Leo Lionni. In this measuring lesson, students work in small groups to create an Inch Poster. Students then use an inch ruler to measure different objects...
Curated OER
Graphing Favorite Holidays
Students create spreadsheets and bar graphs based on results of survey of favorite holidays.
Curated OER
Number Crunching
Students are shown 3-5 different types of crunches as well as the correct Fitnessgram curl-ups. They do sets of different types of crunches and count the total number by using multiplication skills. Studnets do multiple sets and count...
Curated OER
George Gorilla and Gallon Gorp
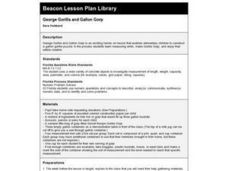
Students study units of measure like cups, pints, quarts and gallons. They work in groups to create their own mixtures of trail mix using the measuring cups. Then they make a gorilla puzzle using a gallon bottle.
Curated OER
The One-Hundredth Day of School
Students use their fine motor skills to create a pattern of one-hundred fruit cereal O's using the concept of counting by tens in order to create a one-hundredth day of school necklace.
Curated OER
100 Stamps for 100 Days
Second graders count by 2's to get to 100. In this counting lesson plan, 2nd graders use the program Kid Pix to create stamps two at a time until they get to 100.
Curated OER
Circles Minilab
Young scholars learn how to measure the diameter and circumference of a circle. For this circle lesson, students organize their data to create a graph. Young scholars utilize their graph to make an inference about the slope of pi.
Curated OER
Radioactive Decay Curve
Students gather and organize data. In this radioactive decay curve lesson, students gather data as they follow the provided procedures for rolling dice. Students chart their data and examine interval results.
Curated OER
A Day at the Beach
Student read Sheryl Wilson's story, "A Day at the Beach" while classifying items they find. They design a chart of the items before using educational graphing software to create a graph.
Curated OER
Construct Figures to Find Specific Volume
Sixth graders use number cubes to explore volume of two-dimensional shapes. They roll a die and construct a shape using the numbers rolled as measurements of the sides. They estimate the volume of a given object, and then use the...
Curated OER
Cubic Volume
Fifth graders record measurements and calculate the volume. They select and use appropriate units and procedures to measure volume # use tools such as technology to solve problems


