Kenan Fellows
Let's Move
Find a statistical reason for a fresh start. Using a hypothetical scenario, individuals research statistical data of three different cities. Their goal? Find the best statistical reason for a business to move to a new location. Their...
Curated OER
Valentine Candy Count
Here is an imaginative take on a classic lesson! Young scholars discover what color Valentine Candy is found more often than any other in a standard bag of Valentine Conversation Hearts. They observe, predict, sort, and classify the data...
Curated OER
Reading Tally Chart
As learners explore data analysis have them practice reading tally charts using these examples. They answer basic questions about each of three charts, employing addition and subtraction skills. For example, a chart tallying t-shirts...
Curated OER
History of Toys and Games
Students research history of popular toys to learn when those toys were first introduced. They use measurement skills to create an accurate timeline.
Curated OER
Fantasy Baseball
Check out this thematic unit, based on the game of baseball. Learners investigate numbers and number relations as they become familiar with some of the basic terminology associated with the game. They focus their attention on actual...
101 Questions
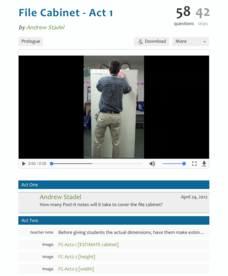
File Cabinet
Take the resource out of the file cabinet. Young mathematicians estimate the number of sticky notes it would take to cover the surface area of a file cabinet. They answer a set of questions on how the number of sticky notes would change...
101 Questions
Finals Week
What energy drinks have the highest concentration of caffeine? Pupils compare five energy drinks with different amounts of caffeine and different volumes. They must solve the ratios to understand the differences. An extension compares...
101 Questions
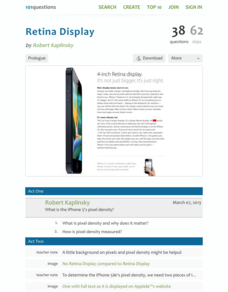
Retina Display
Learners calculate the pixel density of a specific cell phone using the concept of similarity. They use information from the cell phone's website to make their calculations and then compare their results to the posted information.
Curated OER
Exploring Numbers
Start this short plan by greeting your youngsters in Spanish. In this 15 or 20 minute lesson, you'll review numbers one through 10 before working on numbers up to 20. Use pictures to give learners something visual to count. If time, the...
Curated OER
Fraction Conversion Bingo
Middle schoolers reinforce previous math lessons involving the relationships between fractions, decimals and percents.
Curated OER
Go Fish!
Students collect data, interpret data summarize proportional reasoning. Students determine (with various alternate goods) the number of fish in a nearby pond. Students capture the goldfish crackers, deal with pretzels and then write...
Curated OER
Basic Algebra and Computers: Spreadsheets, Charts, and Simple Line Graphs
Students, while in the computer lab, assess how to use Microsoft Excel as a "graphing calculator." They view visual representations of line graphs in a Cartesian plane while incorporating basic skills for using Excel productively.
Curated OER
Valentine Candy Count
Students analyze a bag of Valentine candy to create a graph. For this graphing lesson, students make predictions, sort by color, record data and make a graph. Students discuss results and make generalizations. Students generate their own...
EdHelper
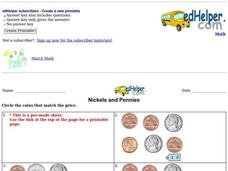
Nickels and Pennies
For this coin activity, students circle the coins that match a "price tag" beneath their picture. Worksheet is from a subscription site with links and is labeled as a sample.
Curated OER
Oodles of Noodles
Learners investigate non-standard and standard measurement including inches and centimeters. They use different types of noodles as non-standard units of measurement comparing them to inches and centimeters.
Curated OER
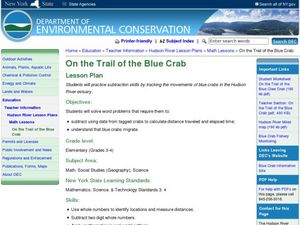
On the Trail of the Blue Crab
Third graders read the article "Blue Claw," discuss crab migration, and look at a map of the Hudson River. They complete a worksheet where they must use subtraction to determine the distance migrating crabs travel.Web links, article, and...
Education World
Greater Than or Less Than With "Mr. Great"
Those tricky symbols for greater than and less than have stumped young mathematicians for generations. Mr. Great is a paper plate cut into a Pac-Man shape that can be used to keep track of which direction the symbols should face. This...
Curated OER
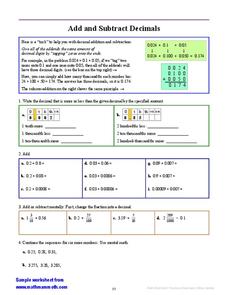
Add and Subtract Decimals
In this decimal learning exercise, students read about adding and subtracting, then complete a set of 31 problems, adding, subtracting, solving for values of expressions and solving equations.
Curated OER
Hypatia: Angles
Introduce your young geometers to Hypatia, the first noted Greek female mathematician, and the properties of angles. Though this resource is missing worksheets that are needed to complete the lesson plan, the structure is sound and...
Curated OER
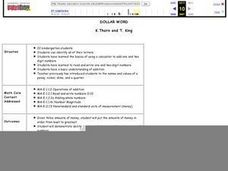
Dollar Word
Students review the value of coins prior to adding up values to equal one dollar. Letters of the alphabet are assigned monetary values and students use calculators to add up the value of a word. Students work with a partner to try and...
Curated OER
Lesson 3 How Do You Read Stock Quotes Online ?
Young scholars understand how to get and interpret stock price data online. They describe certain aspects of various corporations and know the meanings of important terms involving the stock market.
Curated OER
Striking a Balance
Students participate in an activity that demonstrates the principles and dynamics of food chains. They discover that the sun's energy is captured by individual plants and transferred to animals.
Curated OER
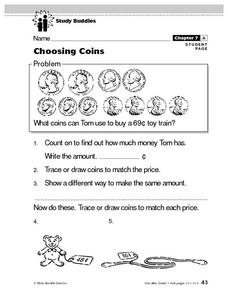
Choosing Coins
For this mathematics worksheet, 1st graders identify what coins can be used to buy a toy train. Then they count out how much money is given and write that amount in cents. Students also trace or draw the coins to match each price listed.
Curated OER
M&M Ratios
Third graders explore ratios. In this probability lesson, 3rd graders sort and count M&M's and identify the ratios of different colors. Students use the attached worksheet as an assessment.


