Illustrative Mathematics
Base and Height
It is easy to find the area of a triangle where the base and the height are given. But in this resource, it is up to your geometers to identify the base and height of the triangle. In fact, your pupils will learn that there are three...
MARS, Shell Center, University of Nottingham
Defining Regions Using Inequalities
Your young graphers will collaboratively play their way to a better understanding of the solution set produced by the combining of inequalities. Cooperation and communication are emphasized by the teacher asking questions to guide the...
Alberta Learning
Area and Perimeter of Irregular Shapes
Evaluate young mathematicians' understanding of area and perimeter with this series of three assessment tasks. Challenging learners to not only calculate the area and perimeter of irregular shapes, but to explain in writing their...
Code.org
Making Data Visualizations
Relax ... now visualize the data. Introduce pupils to creating charts from a single data set. Using chart tools included in spreadsheet programs class members create data visualizations that display data. The activity encourages...
University of Utah
Representations of a Line
Line up to learn about lines! Scholars discover how to express patterns as linear functions. The workbook then covers how to graph and write linear equations in slope-intercept form, as well as how to write equations of parallel and...
West Contra Costa Unified School District
Divisibility Rules Justified
How do you know if a number is divisible? Instructors first prove the divisibility rules for three and four and then class members use this modeling to prove given divisibility rules for eight and nine either individually or in groups.
West Contra Costa Unified School District
Pythagorean Theorem and Its Converse
Challenge scholars to prove the Pythagorean Theorem geometrically by using a cut-and-paste activity. They then must solve for the missing sides of right triangles.
Teach Engineering
What Does Light See?
The second installment of a seven-part series focuses on the refraction of light and how it affects the colors we see. Learners consider how this concept connects to biosensors for cancer detection.
Teach Engineering
Quantum Dots and the Harkess Method
The Fantastic Voyage is becoming close to reality. The class reads an article on the use of nanotechnology in the medical field and participate in a discussion about what they read. The discussion method helps class members become more...
Virginia Department of Education
Simplifying Square Roots of Whole Numbers
Simplify your life by using a resource on simplifying square roots. Pupils review square roots and calculate values of given radical expressions using a calculator. The lesson concludes by having them consider the results to develop the...
Teach Engineering
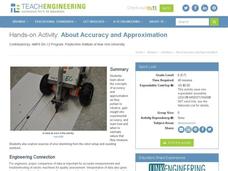
About Accuracy and Approximation
How accurate are robots? Groups draw lines by moving robots backwards and forwards by one rotation of the wheels. Using the appropriate formula, they determine the percent error in the length of the lines in relation to the calculated...
101 Questions
Toilet Paper Roll
You won't want to flush a great lesson down the drain! An intriguing resource asks learners to predict the number of sheets of toilet paper on a roll. Presented with the dimensions of the roll and one sheet of paper, scholars make...
PHET
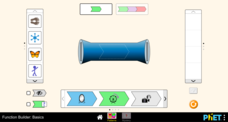
Function Builder: Basics
Learn about functions using the function builder app. A fun online interactive has the class conduct an investigation using a function machine. Inputs are pieces of art, and output are transformations of these pieces of art.
Radford University
Let's Buy a Car
Ready to buy a car? Learners research different makes and models of cars to decide on the best one to buy. They collect data on cost, fuel efficiency, safety ratings, and insurance costs, then create and analyze data displays to make...
Curated OER
Slope-Intercept Form of a Line
Using the subscriber website Explorelearning.com, young mathematicians observe changes in the slope and y-intercept and their effect on the graph of lines. This activity helps students develop an intuitive sense of the connection between...
Curated OER
Conditional Probability and Probability of Simultaneous Events
Your statisticians examine the characteristics of conditional probability and the probability of simultaneous independent events. They perform computer activities to find probabilities for simple compound events. They examine the...
Curated OER
Scale Model of the Solar System
Young scientists gain a better understanding of space, the solar system and its vastness by creating a scale model. Students first need to calculate the distance between each of the nine planets according to the size of their scale. This...
Curated OER
Missing Number
First graders examine how to use a symbol and shape variable to represent a missing value in a mathematical equation. They listen to the book "Fish Eyes" and "One Less Fish," and observe the teacher write an equation represented for each...
Curated OER
Interactivate: Introduction to Functions
This interactive website provides a variety of lesson plans according to which standards you are applying and which textbook you use. Introduce functions to your class by having them construct single operation machines and create...
Curated OER
Multiplication: Bugs Can Multiply, So Can I!
Develop multiplication skills with your class. Youngsters will visualize multiplication as repeated addition. Then they will create a multiplication bug book and discover arrays as a strategy for multiplication problem solving....
Illustrative Mathematics
The High School Gym
Learners apply critical thinking skills as they analyze data about the temperature inside a gymnasium during a school assembly. The focus is on representing temperature as a function of time and interpreting input and output values...
Illustrative Mathematics
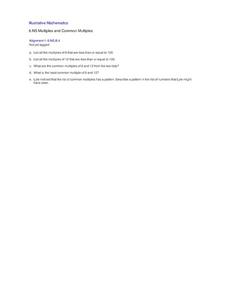
Multiples and Common Multiples
Learners are asked to find multiples and common multiples of two numbers. They must take their findings and find a pattern between the numbers and explain their reasoning. Use this resource with The Florist Shop activity in this series...
Illustrative Mathematics
Fixing the Furnace
This comprehensive resource applies simultaneous equations to a real-life problem. Though the commentary starts with a graph, some home consumers may choose to begin with a table. A graph does aid learners to visualize the shift of one...
Illustrative Mathematics
Mile High
What is the meaning of sea level? This resource helps your class understand the meaning of elevations above, below, and at sea level. Provides for good discussion on using positive and negative numbers to represent quantities in the real...


