Curated OER
Caldecott Medal Winners
Second graders identify Caldecott Medal winners. In this library media lesson, 2nd graders view an overhead transparency of Caldecott Medal winners from 1987-2004 and answer questions based on the data that is displayed.
Curated OER
Working With Coins
Students arrange coins based on their value. In this coins lesson, students trace and record the value of each coin. Students count up to find the total value of all the coins.
Curated OER
Does More Wins Mean More Fans At The Ballpark?
Students, after getting information from the past baseball season off the Internet, calculate an attendance-to-win ratio for each of the 28 major league teams and then study the results to see if winning always leads to good attendance.
Curated OER
A Lesson In Standard Deviation
Students develop an informal understanding of standard deviation by having students find the mean and standard deviation of their hometown and comparing them to a town with a similar mean but a different standard deviation.
Curated OER
Graphing Linear Functions
Students practice solving systems of linear equations using the substitution and elimination methods. They determine if the system has one, infinite or no solution. Students also graph the linear equations.
Curated OER
100 Stamps for 100 Days
Second graders count by 2's to get to 100. In this counting lesson plan, 2nd graders use the program Kid Pix to create stamps two at a time until they get to 100.
Curated OER
A Mars Bar Fraction Hunt Lesson for Grades 3-5
Students use their knowledge of fractions to decipher word puzzles. In this fraction lesson, students use common fractional parts to divide words into the letters needed to make a new word. They complete 28 examples to find a clue that...
Curated OER
Credit Cards and Compound Interests-Exponential Growth
Eleventh graders investigate the way credit cards work when collecting interest. In this algebra lesson, 11th graders investigate the growth of interest exponentially when using a credit card. They calculate what the cheapest rate is to...
Curated OER
Using Fractions to Represent M&M Colors
Young scholars investigate the concept of fraction and tangible application. In this algebra lesson, students use fractions to solve real life scenarios. They convert between fractions and decimals and identify the numerator and...
Curated OER
Cashton Community Quilters
Fourth graders create and construct a fabric quilt symbolizing the heritage of the Wisconsin community of Cashton. They research Wisconsin historical symbols and use math skills to calculate the number and sizes of the quilt squares. ...
Curated OER
Preparation for Engineering Careers
Young scholars explore all the careers that deal with math, science, technology and engineering. They assess the importance of clearly explaing yourself in writing, making public presentations and utilizing technical jargon in dealing...
Curated OER
Composting
Eighth graders collect data from Bottle Biology compost columns and record using Excel spreadsheet.
Curated OER
Numbers One To Ten
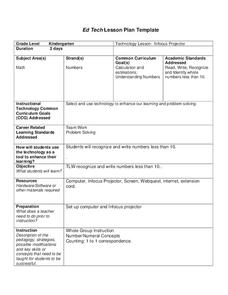
Students read, write, and identify whole numbers one through ten. They explore a variety of websites and complete a WebQuest, count fish and match the numbers to the correct number of fish, and complete a fish counting worksheet.
Curated OER
Shopping for Toys
Students pretend as if they have just won a $100 gift certificate to buy some toys and must try to spend as much of it as they can without going over.
Curated OER
African Rattles
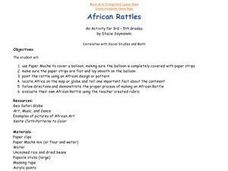
Students locate Africa on the map or globe and tell one important fact about the continent. They follow directions and demonstrate the proper process of making an African Rattle.
Curated OER
Fly Away With Averages
Students study mean, median, and mode. They construct paper airplanes and test them to see how far they fly. They measure the distance and then find the averages of their throws. They use spreadsheet software to record the data in a...
Curated OER
Measuring "pHacts" about Acid Rain
Sixth graders gather and graph information regarding the pH of rain. Working cooperatively with an internet partner, 6th graders gather and record information about the pH of the rain in their local area. They graph this information...
Curated OER
Musical Addition
Students place objects on their storyboards to show the equations that they are given. They draw and color objects to show the equations. Students listen to and sing addition songs.
Curated OER
The Derivation of (Pi)
Seventh graders groups measure the diameter and circumference of each of the circular objects in the room. They record their results on their student worksheets and access a computer spreadsheet program to compile their results.
Curated OER
Graphs Abound
Young scholars create a survey for their classmates to collect data on their favorite foods, eye color, pets or other categorical data. They compile the data from the survey in a table and then make a bar graph of each category using a...
Curated OER
From Home To School
Learners locate and use internet maps to trace a route from their home to school. They calculate the distance of the route using the map legend then determine the distance they travel to school and back in a regular school week and over...
Curated OER
Money
Second graders show combinations for $1.00. In this dollar combinations lesson, 2nd graders use nickels, dimes, and quarters to model and count combinations equaling $1.00.
Curated OER
How Many Ways Can A Team Win A 7-Game Series?
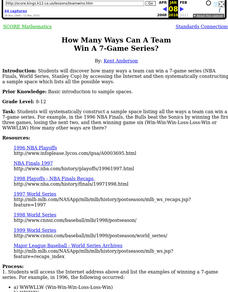
Learners discover how many ways a team can win a 7-game series (NBA Finals, World Series, Stanley Cup) by accessing the Internet. They view sites that cover a variety of sports.
Curated OER
TI-83 Tutorial for statistics
High schoolers learn the uses of the TI-83 calculator for statistical operations.


