Curated OER
Getting it Right! An Investigation of the Pythagorean Theorem
In order to learn about the Pythagorean Theorem, young mathematicians investigate relations and patterns between different sides of a right triangle to look for possible relations among the squared sides. Once they have established the...
Education World
The African American Population in US History
How has the African American population changed over the years? Learners use charts, statistical data, and maps to see how populations in African American communities have changed since the 1860s. Activity modifications are included to...
Curated OER
Pizza! Pizza!
Third graders tally, sort, and organize pizza orders from monthly school sales. They create an advertising campaign to promote the School Pizza Sale, record the data in graph form, compare and contrast the tallies throughout the year,...
Curated OER
Many Paths
Students explore the composition and practical application of parallel circuitry, compared to series circuitry. They design and build parallel circuits and investigate their characteristics, and apply Ohm's law. They recognize that...
Curated OER
Identify and Label Different Types of Angles
Young scholars identify and label acute, obtuse, and right angles within a picture. Using Kid Pix software and digital photos, they manipulate, identify, and label the angles and describe the angles to a classmate.
Curated OER
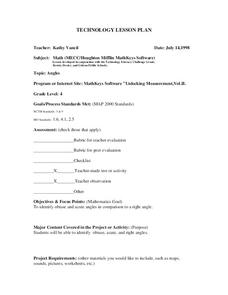
Angles
Learners identify obtuse and acute angles in comparsion to a right angle. They identify obtuse, acute, and right angles. Pupils use "Shape Measure" to construct obtuse, acute, and right angles. They review line segements to locate right...
Curated OER
Cross Cultural Transportation and Resources Exchange
Students examine various modes of transportation. They explore regional transportation options and discover options available in their area. Students survey types of transportation people use in their area. Using spreadsheet data,...
Curated OER
The Very Hungry Caterpillar
Read the story, The Very Hungry Caterpillar, and complete activities from multiple subjects. Make a mural, create a class graph, discuss the life cycle of a butterfly, research information about butterflies on the Internet and make a...
Curated OER
Does Your Field Measure Up
Students measure angles using a plane table kit. In this geometry lesson, students use trigonometric identities to find the values of the length of a football field.
Curated OER
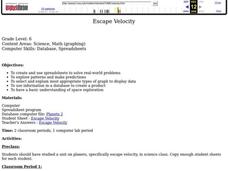
Escape Velocity
Sixth graders create/use spreadsheets to solve real-world problems, explore patterns, make predictions, select/explain most appropriate types of graph to display data, use information to create product, and have basic understanding of...
Curated OER
Counting Coins
Second graders identify a quarter, dime, penny, nickel, and dime. They match the coin with it's monetary value, collect data on excel spreadsheet, and create a graph in Excel. Students participate in group activities.
Curated OER
It's Your Life - Safe or Sorry/Safety Issues
Young scholars examine and chart data about safety hazards and unsafe situations. In this safety hazard lesson, students examine newspapers and web sites to investigate injuries from safety hazards. They make a spreadsheet using the data...
Curated OER
Graphing Systems of Inequalities
Solve equations and graph systems of inequalities. Designed as a lesson to reinforce these concepts, learners revisit shading and boundaries along with solving linear inequalities.
Curated OER
Exploring Transformations
Students explore what happens when geometric figures are transformed on the coordinate plane. They work in pairs, moving geometric shapes in the plane, and formalize their rules as functions.
Curated OER
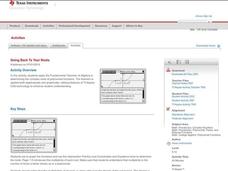
Going Back to Your Roots
Investigate the Fundamental Theorem of Algebra and explore polynomial equations to determine the number of factors, the number of roots, and investigate multiplicity of roots.
EngageNY
Directed Line Segments and Vectors
Investigate the components of vectors and vector addition through geometric representations. Pupils learn the parallelogram rule for adding vectors and demonstrate their understanding graphically. They utilize the correct notation and...
EngageNY
Modeling with Inverse Trigonometric Functions 1
Where should I stand to get the best view? Pupils use inverse trigonometric functions to determine the horizontal distance from an object to get the best view. They round out the lesson by interpreting their answers within context.
Curated OER
It Just Keeps Going and Going...
Students explore patterns, identify patterns, and complete a variety of patterns. They view and discuss an online video and identify the different patterns from the film, then using a hundreds grid create an original pattern using their...
Curated OER
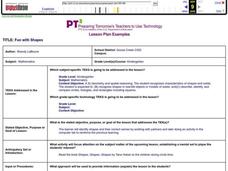
Fun with Shapes
Young mathematicians identify shapes and their correct names. They work with partners using various manipulatives and computer software to reinforce the concept. I really like these lesson plans. They are well-designed, the procedures...
Curated OER
The Battle for Ultimate Power
Middle schoolers gain an understanding of how the powers of 10 and scientific notation can be used to represent the scale of things in the universe. They relate the number of stars in the universe to the number of grains of sand on...
Curated OER
Get the Picture!
Astronomers practice downloading data from a high-energy satellite and translate the data into colored or shaded pixels. As a hands-on activity, they use pennies to simulate high-energy satellite data and they convert their penny...
Curated OER
History of Toys and Games
Students research history of popular toys to learn when those toys were first introduced. They use measurement skills to create an accurate timeline.
Alabama Learning Exchange
Abundant Area
Explore the relationship between perimeter and area. Learners input the area and perimeter for shapes on the Shape Explorer website, solve problems using geoboards, complete a worksheet, create a PowerPoint presentation, and take an...
Curated OER
Conversation Heart Graphing
Sixth graders review the different types of graphs (bar, line, pictograph) They predict the data set they can garner several boxes of conversation hearts. Students record their data using an Excel spreadsheet. They create a graph based...
Other popular searches
- Educational Technology Math
- Immigrant Math Technology
- Math Technology Projects
- Math Technology Triangles
- Math Technology Excel
- Computer Technology Math
- Surveys Math Technology
- Math Technology Lesson Plans
- Technology +Math
- Math Technology Lesson
- Gps Technology Math Science
- Technology Math Lesson Plan


