Statistics Education Web
Text Messaging is Time Consuming! What Gives?
The more you text, the less you study. Have classes test this hypothesis or another question related to text messages. Using real data, learners use technology to create a scatter plot and calculate a regression line. They create a dot...
Curated OER
Technology Integrated Lesson
Students investigate symmetry in the real world. In this geometry lesson, students inter-relate math and technology. They create and name a variety of polygons.
Curated OER
Technology Lesson Activity: Fractions
Fifth graders practice using the English measuring system by creating fractions. In this parts of a whole lesson plan, 5th graders combine math key bars to simulate small parts of a bigger item. Students combine the pieces to create...
Curated OER
Careers in Mathematics Project
Students use technology (Internet, email) to research mathematics in nonacademic careers in order to increase their awareness and appreciation of mathematics in the "real world."
Curated OER
Writing up Math in English
Seventh graders review the steps in writing a math problem. They write story problems stating the situation, the problem to be solved, explaining the process used to solve the problem, and state the answer. Students view a PowerPoint...
Curated OER
Where's the Math?
Fourth graders create an original math problem with a detailed solution key relative to their chosen career fields.
Curated OER
Technology in 2nd Grade
Second graders explore ways to use computers. They practice spelling words using Kid Pix software, write Bible verses and illustrate them. They read stories and illustrate and write about their favorite characters. They create pattern...
Teach Engineering
Working Together to Live Together
Whose home is it anyway? Design teams plan a housing development in which they must also protect a native species. The teams consist of a project manager, civil engineer, environmental engineer, and graphic designer. Teams present their...
Ohio Literacy Resource Center
Solving Systems of Linear Equations Graphing
Do you need to graph lines to see the point? A thorough lesson plan provides comprehensive instruction focused on solving systems of equations by graphing. Resources include guided practice worksheet, skill practice worksheet, and an...
Mascil Project
Parachute Food Drop
Drop a perfect project into your lesson plans. Groups use different building materials to create models of parachutes for food drops. After testing out their prototypes, they make improvements to their designs.
Facebook
Social Media and Sharing
Whether it's cute cat videos or pictures from an epic vacation, scholars love to check out what's happening on social media! But, how much sharing is too much? A lesson from a vast digital citizenship series poses some serious points to...
Curated OER
Statistics Newscast in Math Class
Students study sports teams, gather data about the teams, and create a newscast about their data. In this sports analysis instructional activity, students research two teams and define their statistical data. Students compare the two...
Curated OER
Connecting Math to Our Lives
Students participate in an online interactive forum to explore how math is used in their families and communities. They design games to submit to other students online, and identify and organize data to solve the problems from other...
Curated OER
Transformations, Tessellations, and Technology
Students complete a unit about transformations and tessellations. They explore various tessellation websites, determine which shapes tessellate, complete a log about which website activities they complete, and create a tessellation...
Curated OER
Math-Measurement
First graders examine measurement. In this measurement lesson plan, 1st graders practice using nonstandard units to help in measuring objects. Students listen to How Big is a Foot and complete an activity using unifix cubes to measure...
Alabama Learning Exchange
Technology for Displaying Trigonometric Graph Behavior: Sine and Cosine
Students explore the concept of sine and cosine. In this sine and cosine activity, students work in groups to graph sine and cosine functions. Students examine how coefficients in various parts of each parent function shift the graph. ...
Curated OER
Motherhood Math: Mothers in the Workforce
Students evaluate a table showing how the number of working mothers increased between 1955 and 2000. They use the information from the table to complete a worksheet imbedded in this lesson plan.
Curated OER
Modeling Multiplication and Division of Fractions
Create models to demonstrate multiplication and division of fractions. Using fraction tiles to model fractions, pupils explore fractions on a ruler and use pattern blocks to multiply and divide. They also create number lines with fractions.
media.yurisnight.net
Science Lesson Plan: Our Solar System: I Wonder?
Ever wonder why Pluto isn't considered a planet? Or how large the Earth is compared to the other inner planets? Explore the universe with a series of projects that simulate different aspects of our solar system. The activities require...
National Research Center for Career and Technical Education
Break-Even Point
How do companies determine the prices of their products? Marketing maestros discover the concepts of cost and break-even point through discussion, independent practice, and a collaborative assessment. The career and technology-oriented...
Curated OER
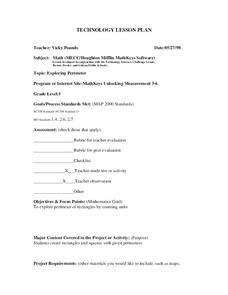
Exploring Perimeter
Learners explore perimeter. In this geometry and measurement lesson plan, students create squares and rectangles using given perimeters. Learners construct four sided shapes with given perimeters using the computer program "Math Keys:...
Curated OER
Sextant Solutions
Middle schoolers explore ways a sextant can be a reliable tool that is still being used by today's navigators and how computers can help assure accuracy when measuring angles. This activity will show how computers can be used to...
Curated OER
Data With Candy
Students, while utilizing the classroom and the computer lab with a bag of colored candy, gather and interpret data, calculate averages and draw conclusions and draw a bar graph. They estimate how many candies are in the bag, what...
Curated OER
Analyzing Discrete and Continuous Data in a Spreadsheet
You are what you eat! Your statisticians keep a log of what they eat from anywhere between a day to more than a week, keeping track of a variety of nutritional information using a spreadsheet. After analyzing their own data, individuals...


