Curated OER
Geoboard Squares
Students create squares of different sizes on a geoboard. They find and describe a pattern. Students use the pattern to determine the number of squares possible on a 10-by-10 geoboard. They create squares with a horizontal base (and...
Curated OER
What Are My Chances?
Students calculate probability. In this lesson on probability, students use given data to calculate to chances of a given event occurring. Many of the calculations in this lesson are applicable to daily life.
Curated OER
Adding Negative Numbers
In this integers worksheet, learners solve 16 addition problems by adding two integers together. There is no answer...
Curated OER
Maps
Learners investigate threee types of maps. In this algebra lesson, students idenitfy different maps and explore how they relate to the area keeping cllimate and topography in mind. They discuss maps used to navigate land. air and sea.
Curated OER
For The Birds
Seventh graders list the features of an ecosystem and identify local bird species. In this bird lesson students work in groups to formulate a hypothesis and test their theory by collecting and analyzing data.
Curated OER
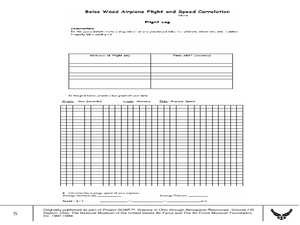
Balsa Wood Airplane Flight and Speed Correlation
Ninth graders calculate the average speed of their balsa wood airplane. In this physics lesson, 9th graders build their own airplane and make necessary modifications to to make it fly straight. They interpret distance and time graph...
Curated OER
Does Shape Affect Drag?
Students study drag and how it affects a parachute in the sky. In this parachutes instructional activity students build models and compare their drag.
Curated OER
Porosity and Permeability
Students examine the concepts of porosity and permeability. They conduct experiments to determine the porosity and permeability of gravel, sand, and clay. After performing the experiments they collect and graph data, comparing the...
Curated OER
Squid Races
Students imitate squid propulsion using a balloon and experience Newton's third law: for every action there is an equal and opposite reaction. Various anatomical designs are tested and analyzed. They calculate the speed of each squid...
Curated OER
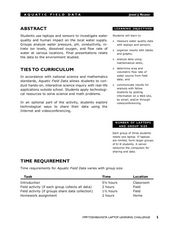
Aquatic Field Data
Students use laptops and sensors to measure water quality and graph their results. In this aquatics lesson students post their results to a website or email.
Curated OER
Texas Estuary Project
Learners take a field trip to a local estuary and analyze water samples. They analyze and graph the data results, write an essay, and create a food web of their field site.
Curated OER
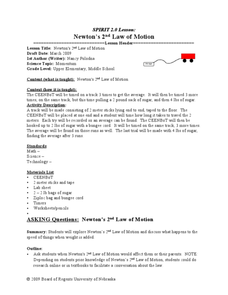
Newton's 2nd Law of Motion
Students investigate how mass affects the speed of an object. In this physics instructional activity, students record data on the data table and graph results. They analyze findings and formulate a conclusion.
Curated OER
Relations and Functions
In this Algebra II activity, 11th graders identify the domain and range of a relation and determine if the given relation is a function. The three page activity contains explanation and eighteen practice problems. Answers are...
Curated OER
Survey Project
Eighth graders create a website using FrontPage. They use inserted forms to collect survey information and use Microsoft Excel and MS Word to create a presentation of the survey and the results.
Curated OER
How Sharp Is Your Memory?
Students play a memory game as they explore reasoning. In this algebra lesson, students identify concepts using pictures and words. They model real life scenarios using hands on manipulatives.
Curated OER
Measurement
Students choose appropriate units of measure and predict length using the metric system. In this measurement activity, students participate in activities in which they predict, measure, and record linear measurements such as arm span vs....
Curated OER
Friction This
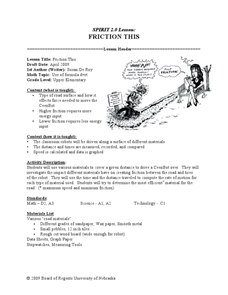
Middle schoolers investigate road surface and calculate speed. In this algebra instructional activity, students analyze the roughness of a road and calculate distance and speed based on friction. They relate friction and energy to speed.
Curated OER
How Safe Is Your Backyard?
Seventh graders investigate the safety of soil and water locally and communicate via the Internet with students in different locales sharing information. They research the Internet using its multimedia capabilities and collate the data...
Curated OER
INTERPRETING MAGNETIC FIELD MAPS
Students interpret magnetic field maps, rotate the coordinates to obtain different views, change the coordinate representation, and produce alternate graphical representations.
Curated OER
Direct and Inverse Variation
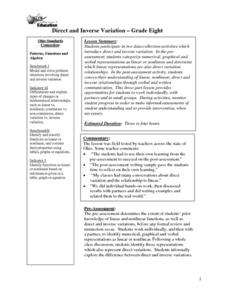
Eighth graders participate in two data collection activities that involve direct and inverse variation. In the pre-assessment, 8th graders categorize numerical, graphical, and verbal representations as linear or nonlinear and determine...
Curated OER
A Statistical Look at Jewish History
Learners complete their examination over the Jewish Diaspora. Using population figures, they discover the importance of percentages in exploring trends. They use their own ethnic group and determine how it is represented in the United...
Curated OER
Questionnaires and Analysis
Students, review the techniques and different types of data analysis as well as how they are expressed, identify why facts and data are needed in conclusion of a questionnaire. The concepts of qualitative and quantitative data are...
Curated OER
Twenty Multiple Choice and Free Response Derivative Problems
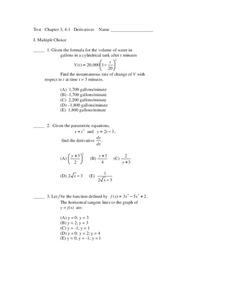
In this derivative worksheet, students solve ten multiple choice and ten free response problems. These problems include: derivatives of trig functions, tangent lines, parametric equations, and instantaneous rates of change.
Curated OER
Let's Take a Chance!
Students investigate probability and the chance of an even happening. In this algebra lesson, students incorporate their knowledge of probability to solve problems and relate it to the real world. They learn to make decisions based on data.


