National Council of Teachers of Mathematics
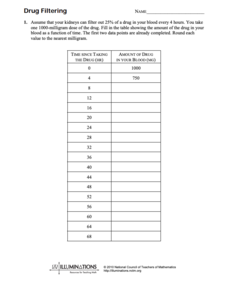
Drug Filtering
In this chemistry instructional activity, learners calculate the amount of drug found in someones blood based on how long they have been taking the drug. There are 5 questions.
Curated OER
Does Weight Affect Drag?
Students investigate how weight affects a parachute's rate of fall. In this investigative lesson students test parachutes, average results and conclude what makes a faster descent.
Curated OER
Best Practices
Students are encouraged to do their best on the mile run portion of the fitness test. They also gain knowledge about fitness in other academic areas of the school too. In science, the class records resting pulse rates, in math, charts...
Mathematics Vision Project
Quadratic Equations
Through a variety of physical and theoretical situations, learners are led through the development of some of the deepest concepts in high school mathematics. Complex numbers, the fundamental theorem of algebra and rational exponents...
Curated OER
Bungee M&M's
Science is exciting - and delicious! Pairs of learners set up a bungee cord type of experiment. They use buckets filled with M & M's, a meter stick, and a Slinky spring (as the bungee) to conduct their experiment. A good activity...
Curated OER
Aerospace Engineering
Twelfth graders examine the physics of rocket flight. They build and launch model rockets to measure their performances.
Teach Engineering
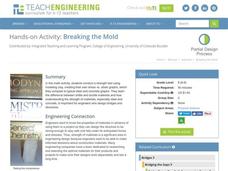
Breaking the Mold
A little too much strain could cause a lot of stress. Groups conduct a strength test on clay. Using books as weights, pupils measure the compression of clay columns and calculate the associated strain and stress. Teams record their...
Curated OER
TE Activity: Bubbling Plants
Students study a way to quantify the process of photosynthesis during a given time using the Elodea plant. They design a hypothesis that they test in the hands on activity. They compare the amounts of photosynthesis that occur during low...
Curated OER
Ball Bounce Experiment
Students investigate different balls' abilities to bounce. They conduct a Ball Bounce Height Comparison and Ball Bounce Time Comparison, complete a worksheet, graph the results of their experiment, and answer investigating questions.
Curated OER
Teaching Reading Comprehension through Social Studies Readings
Examine how immigrants have changed the environment of the United States. Individually, middle schoolers will take a pre- and post-test to assess their reading comprehension. In groups, they compare and contrast the religions of...
Curated OER
Examining The Scores
Students investigate test scores taken to obtain academic strengths and weaknesses. They practice looking at the scores in order to interpret the results. Students use time for class discussion and planning study strategies to target...
Curated OER
Data Collection Project
Students collect data using email. They calculate the mean, median, mode, range and outliers. They create a graph using the data results. They write five paragraphs to summarize their data.
Curated OER
Apples Galore! (Elementary, Language)
Fifth graders examine and taste 7-8 difference apples, describe the flavor/texture, then graph the results of favorites. Finally students write a paragraph describing their favorite.
Curated OER
Spaghetti Bridges
Eighth graders experiment with building bridges of spaghetti, pennies, and a cup to determine how varying the number of spagetti pieces affects the strength of the bridge. They graph their results and interpret the data.
Curated OER
Attributes of Accuracy
Young scholars explain necessity in using accurate instruments when measuring, and how measurements can be checked for accuracy. They make a six-inch ruler, design, test, and evaluate a system to measure work, and produce a table and...
Curated OER
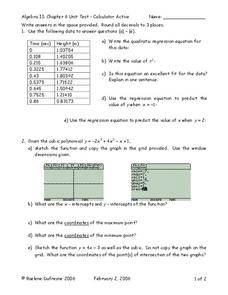
Polynomial Functions
In this Algebra II learning exercise, 11th graders use a graphing calculator to determine the regression equation of the given data, graph polynomial functions, factor polynomials, and determine the quotient and remainder in polynomial...
Curated OER
Radioactive Decay
Students generate a radioactive decay table for an imaginary element, use their data to plot a decay graph, develop the concept of half-life, and use the graph to "age" several samples.
Curated OER
Tune...Um!
Students collect real data on sound. In this algebra lesson, students use a CBL and graphing calculator to observe the graph created by sound waves. They draw conclusion about the frequency of sound from the graph.
Curated OER
Interpreting Data
For this interpreting data worksheet, students solve and complete 4 different types of problems using different data types. First, they collect raw data from a paragraph shown. Then, students identify the examples of two different types...
Curated OER
You Drive Me crazy
Students calculate the distance and acceleration of an object. In this algebra lesson plan, students collect data and create table and graphs to analyze it. They complete a lab as they collect and analyze data on acceleration and distance.
Curated OER
That's a Fine Line You're Walking!
Students experiment with Hiker program to practice real world applications of linear functions and develop their understanding of expressions, relationships, and manipulations involved in writing and graphing linear equations in...
Curated OER
Probability
Students complete various activities for probability. In this probability lesson, students use coins, cubes, peanut butter and jelly, playing cards, number cubes, darts, and a Gauss Curve to study probability. Students must orally...
Curated OER
Flips, Turns, and Slides: Adventures with Transformations
Young scholars explore transformations. In this math lesson, students plot points on a coordinate grid and construct shapes. Young scholars discuss movements on the grid as flips, turns and slides.
Curated OER
Smarty Pants
Students graph the colour distribution found in a packet of Skittle lollies, M&M's, Smarties or similar sweets. Results are compared and recorded against the results of other class members.


