BW Walch
Solving Linear Inequalities in Two Variables
Although graphing a linear inequality on the plane is but a few steps added onto the graphing of a linear equation, for many learners the logical leap is quite intimidating. This approachable PowerPoint presentation breaks graphing...
American Statistical Association
An A-MAZE-ING Comparison
Teach your class how to use descriptive statistics through a hands-on data collection activity. Pupils collect their own data, calculate test statistics, and interpret the results in context. They compare male and female results, looking...
Curated OER
Making Predictions About Measurement
Upper graders experiment with measurement. They estimate the length, volume, and weight of various objects, then rotate through stations making predictions concerning measurements and then testing their predictions.
Curated OER
The Barbie Bungee Drop
What do math, bungee jumping, and Barbie® have in common? Young adventure seekers use rubber bands as bungee cords to predict a thrilling, but safe, jump for their doll. First, test jumps are conducted with a few rubber bands. Then more...
Curated OER
Histograms
Young statisticians explore the concept of histograms. They construct histograms of various data such as change in a student's pocket, and guessing on a test. hHey analyze data represented as a histogram and a box plot and compare...
Curated OER
Reading Graphs
Encourage kids to read line graphs with confidence using these examples and accompanying comprehension questions. Learners examine two graphs and answer four questions about each. This is definitely intended for beginners to this type of...
Curated OER
Fast Talker - Ch 2 project
Tongue Twisters?! Create scatter plot graphs based on timing fellow classmates saying tongue twisters. Then investigate, display, and analyze the relationships based on functions. Wrap up this activity by making a...
American Statistical Association
How Fast Are You?
Quick! Snap up the lesson. Scholars first use an online app to collect data on reaction times by clicking a button when the color of a box changes. They then plot and analyze the data by considering measures of center, measures of...
Curated OER
Minutes and Days
Elapsed time is a skill developed by the single question that is the center of this activity. Fifth graders are asked to find out the time that is 2011 minutes after the beginning of 2011. This question addresses the standard that...
EngageNY
End-of-Module Assessment Task - Geometry (module 3)
It's test time! Determine your class's understanding of the topics of volume and cross sections with a thorough assessment on volume, area, and geometric shapes.
Curated OER
How to Achieve Your Financial Goals
Students explore economics by creating a budget. In this financial goal setting lesson, students investigate their use of time by completing a worksheet. Students identify financial goals they would like to achieve in the next several...
Curated OER
Cutting Expenses
Students explore budgeting. In this finance and math instructional activity, students brainstorm ways in which households could save money. Students view websites that give cost reducing ideas. Students complete an expense comparison...
Mathed Up!
Tallys and Charts
After watching a brief instructional video, young mathematicians are put to the test. By completing and reading frequency tables, tally charts, and bar graphs, individuals show their understanding of how to interpret data.
Mathed Up!
Fractions of an Amount
After viewing a video on fractional amounts, young mathematicians put their new knowledge to the test. Throughout the assessment, class members find the fractional amount for prices, times, and populations. There are a few percent and...
Curated OER
Slope, Vectors, and Wind Pressure
A hands-on instructional activity using the TI-CBR Motion Detector to provide information to graph and analyze. The class uses this information to calculate the slope of motion graphs and differentiate scalar and vector quantities. There...
Curated OER
Integer Solutions to Inequality
When is the last time you assigned your students only one problem? This seemly simple problem requires learners think like a mathematician and reason about how to solve this compound inequality in one variable. More than just using...
Mathed Up!
Addition and Subtraction
After watching a brief video on addition and subtraction, young mathematicians are put to the test. Including 12 problems, individuals solve word problems to find the least number, total amount, and difference of numbers.
Mathed Up!
Fractional and Negative Indices
Explore how to deal with fractional and negative exponents. Scholars watch a video reviewing fractional, zero, and negative exponents. After the video, they test their skills by completing a worksheet covering the concepts.
Mathed Up!
Trigonometry
Learn how to solve a triangle. Young mathematicians view a video that explains how to apply trigonometry to find missing sides and angles of a right triangle. A learning exercise tests their understanding of the concept.
Teach Engineering
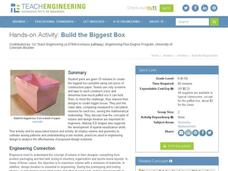
Build the Biggest Box
Boxing takes on a whole new meaning! The second installment of the three-part series has groups create lidless boxes from construction paper that can hold the most rice. After testing out their constructions, they build a new box....
Curated OER
Chances Are......You're Right
Young mathematicians study probability. In this math lesson, learners calculate odds, and convert those into percentages of probability. Fractions are also used, making this lesson quite rich in some of the more difficult conversions...
EngageNY
Experiments and the Role of Random Assignment
Time to experiment with mathematics! Learners study experimental design and how randomization applies. They emphasize the difference between random selection and random assignment and how both are important to the validation of the...
EngageNY
Matrix Addition Is Commutative
Explore properties of addition as they relate to matrices. Using graphical representations of vector matrices, scholars test the commutative and associative properties of addition. They determine if the properties are consistent for...
Curated OER
Speed
Fifth and sixth graders practice working in pairs to determine whether they can walk with constant speed. They test themselves, collect their data, draw graphs with their data collected, manipulate the data, and then draw conclusions...


