Curated OER
Weather
Students participate in a variety of mini-lessons including experiments, literature readings, physical education components, music, data gathering and recording and more to expose them to several themes of weather; i.e. water cycle,...
Curated OER
Water Cycle: Weather Lesson 1
First graders go on a water walk, collect weather data, and measure rainfall for a month. They examine the water cycle in this series of lessons.
Curated OER
Scientific Graphs
Students organize data collected from their experiments using graphs. In this statistics and biology lesson, students organize their scientific data from an article into readable graphs. They define the usefulness of their graph and...
PBS
Blow the Roof Off!
Blow the minds of young scientists with this collection of inquiry-based investigations. Based on a series of eight videos, these "hands-on, minds-on" science lessons engage young learners in exploring a wide range of topics...
Curated OER
Beary O'Mometer Learns About Careers In Meteorology
Students explore the field of meteorology. In this meteorology lesson plan, students explore weather-related careers as they research the field of study as well as various weather concepts. Students interview meteorologists, write...
Curated OER
Phenomenal Weather-Related Statistics
Eighth graders research, collect and interpret data about weather statistics. They record that data on spreadsheets. they create Powerpoint presentations on their individual or group research.
Rice University
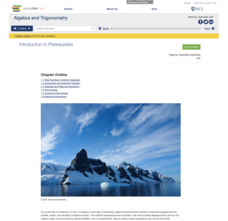
Algebra and Trigonometry
Move on into trigonometry. An informative eBook takes the content of a College Algebra course and adds more relating to trigonometry and trigonometric functions. The content organization allows pupils to build upon their learning by...
Curated OER
Hurricanes on Track
Fifth graders develop a questionnaire to investigate weather in different part of the US. They investigate how weather in one part of the country affects weather in another part. They predict the development of hurricanes.
Curated OER
MAISA and the REMC Association of Michigan
Students complete online research to study geography's impact on weather. In this geography and weather lesson, students research weather in their city for ten days using an online website. Students bookmark the site, enter data into a...
Curated OER
Predicting Temperature: An Internet/Excel Learning Experience
Third graders use the Internet (www.weather.com) to find the high temperature for our locale and the high temperature for another city around the world. They keep track of the temperature in these two locations for 10 days.
Curated OER
Sensational Seasons
Second graders explore how seasonal weather patterns affect temperature and their lives.
Curated OER
Keep Your Eye on the Sky
Students examine the different types of satellites, cloud formations and weather patterns. In this weather lesson plan students use the Internet to research weather satellites, then write an article and create graphs.
Curated OER
Weather Or Not
Students use the internet to find pen pals to share in their weather experiment. Individually, they research the high and low temperatures for cities within the United States and email the results to their pen pal. They also develop a...
Curated OER
Wet Weather, Wet Climate
Students discover the differences between weather and climate in this long-term lesson introduction. They create rain gauges and practice reading rainfall measurements, view a website showing the cloud cover in their location and draw...
Curated OER
Good News - We're on the Rise!
Students build and observe a simple aneroid barometer to discover changes in barometric pressure and weather forecasting. They graph changes in barometric pressure for two weeks and make weather predictions.
Curated OER
Temperature High and Lows
Students gather high and low temperature readings through email. For this temperature graphing lesson, students use a spreadsheet to input data for a graph. students interpret the graphs to compare and contrast the data from different...
Curated OER
Scatter Plots
Seventh graders investigate how to make and set up a scatter plot. In this statistics instructional activity, 7th graders collect data and plot it. They analyze their data and discuss their results.
Curated OER
Understanding Cloud Formation
Students read and relate the poem, "Clouds" by Aileen Fisher to a demonstration on cloud formation. They create clouds in jars using ice water and matches then discuss the ways clouds can be used to predict weather.
Curated OER
Highs and Lows
Students use email to chart weather patterns and then graph their findings. In this weather patterns lesson, students chart their weather for a week at the school. Students then use email to find temperatures at a variety of locations....
Curated OER
Sweethearts and Data Analysis
Learners explore the concept collecting and representing data. For this collecting and representing data lesson, students record the different colors of sweetheart candies in their sweethearts box. Learners create a table of the data and...
Curated OER
Bar Me In
Fourth graders watch a video about constructing bar graphs. They create their own graph and interpret it.
Curated OER
Tech Algebra: A Statistics Study
Young scholars use the internet to gather a minimum of thirty pieces of data. Students create box and whisker graphs, and stem and leaf plots from the information. They calculate mean, median, mode, and range. Young scholars write a...
Curated OER
Picnic Possibilities
Fourth graders plan a picnic using weather data. Using accumulated weather data from various sources, they create a graph of the weather conditions in their region for a given period of time. Students interpret this data to predict the...


