Curated OER
Calculator Trick 1
Here is a fun calculator trick, perfect for getting your learners ready for a day of exciting math. They multiply any single-digit number by 12,3456,789 to reveal an amazing result. Teaching notes are included on two of the slides.
EngageNY
More on Modeling Relationships with a Line
How do you create a residual plot? Work as a class and in small groups through the activity in order to learn how to build a residual plot. The activity builds upon previous learning on calculating residuals and serves as a precursor to...
Mathematics Vision Project
Module 5: Modeling with Geometry
Solids come in many shapes and sizes. Using geometry, scholars create two-dimensional cross-sections of various three-dimensional objects. They develop the lesson further by finding the volume of solids. The module then shifts to finding...
Futures Channel
Algebra Magic
Abracadabra! Letters can be used in math to represent numbers with the operations of addition, subtraction, multiplication, and division to solve problems! Math magicians will participate in an activity that uses a calculator and a bag...
PBS
Adventures With The Fish Pond: Population Modeling
Build up from the previous activity where your learners charted the population growth and decay of a fish pond with M&Ms®. Have them look at the data from that activity and create a Now-Next, or recursive equations, to predict the...
EngageNY
Families of Parallel Lines and the Circumference of the Earth
How do you fit a tape measure around the Earth? No need if you know a little geometry! Pupils begin by extending their understanding of the Side Splitter Theorem to a transversal cut by parallel lines. Once they identify the proportional...
EngageNY
How Far Away Is the Moon?
Does the space shuttle have an odometer? Maybe, but all that is needed to determine the distance to the moon is a little geometry! The lesson plan asks scholars to sketch the relationship of the Earth and moon using shadows of an...
EngageNY
Modeling Riverbeds with Polynomials (part 2)
Examine the power of technology while modeling with polynomial functions. Using the website wolfram alpha, learners develop a polynomial function to model the shape of a riverbed. Ultimately, they determine the flow rate through the river.
Charleston School District
Pre-Test Unit 6: Systems
As if solving equations with an x isn't tricky enough, now they add a y, too? A pre-assessment gauges the knowledge of your classes related to systems. They are asked to solve graphically and algebraically and to solve word problems.
Mathed Up!
Reverse Percentages
Boost math skills and inspire scholars to show what they know with a six-page independent practice that focuses on proportional relationships and percents.
Fall River Schools
Parabolas Are All Around Us
Moving parabolas off of graph paper and into the real world is the task at hand in this detailed poster project. First, learners perform a cumulative activity identifying many characteristics of an assigned quadratic equation. Next, they...
Illustrative Mathematics
Eratosthenes and the Circumference of the Earth
The class gets to practice being a mathematician in ancient Greece, performing geometric application problems in the way of Eratosthenes. After following the steps of the great mathematicians, they then compare the (surprisingly...
EngageNY
Modeling with Quadratic Functions (part 1)
Relevance is key! The resource applies quadratic modeling by incorporating application of physics and business. Pupils work through scenarios of projectile motion and revenue/profit relationships. By using the key features of the graph,...
EngageNY
Federal Income Tax
Introduce your class to the federal tax system through an algebraic lens. This resource asks pupils to examine the variable structure of the tax system based on income. Young accountants use equations, expressions, and inequalities to...
US Department of Commerce
Applying Correlation Coefficients - Educational Attainment and Unemployment
Correlate education with unemployment rates. Individuals compare state and regional unemployment rates with education levels by calculating the correlation coefficient and analyzing scatter plots. Pupils begin by looking at regional data...
Los Angeles County Office of Education
Assessment For The California Mathematics Standards Grade 6
Test your scholars' knowledge of a multitude of concepts with an assessment aligned to the California math standards. Using the exam, class members show what they know about the four operations, positive and negative numbers, statistics...
Curated OER
Unit 11 Year 5
Apparently unit 11 covers a range of topics related to problem solving, addition, and subtraction. This complete unit presentation is intended for use over a series of days or weeks. It contains numerous visual aids to accompany lessons...
Statistics Education Web
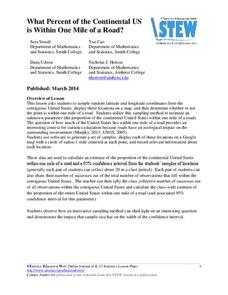
What Percent of the Continental US is Within One Mile of a Road?
There are places in the US where a road cannot be found for miles! The lesson asks learners to use random longitude and latitude coordinates within the US to collect data. They then determine the sample proportion and confidence interval...
Howard County Schools
Building a Playground
Scholars crave practical application. Let them use the different models of a quadratic function to plan the size and shape of a school playground. They convert between the different forms and maximize area.
PBS
A Little Recycling Goes A Long Way
Every time you purchase something from the store, it goes into a bag, but what happens to the bag? This lesson encourages your learners to think about what happens to those plastic and paper bags and their effect on the environment. Use...
EngageNY
Modeling a Context from a Verbal Description (part 1)
When complicated algebraic expressions are involved, it is sometimes easier to use a table or graph to model a context. The exercises in this lesson are designed for business applications and require complex algebraic expressions.
EngageNY
Bean Counting
Why do I have to do bean counting if I'm not going to become an accountant? The 24th installment of a 35-part module has the class conducting experiments using beans to collect data. Learners use exponential functions to model this...
American Statistical Association
What Fits?
The bounce of a golf ball changes the result in golf, mini golf—and a great math activity. Scholars graph the height of golf ball bounces before finding a line of best fit. They analyze their own data and the results of others to better...
Yummy Math
Which is the Best Deal on Candy?
Buying enough candy for trick-or-treaters without spending a lot of money can be the ultimate Halloween trick. Middle schoolers solve two holiday-themed word problems to determine which brand of candy is the better deal, based on cost...


