EngageNY
The Difference Between Theoretical Probabilities and Estimated Probabilities
Flip a coin to determine whether the probability of heads is one-half. Pupils use simulated data to find the experimental probability of flipping a coin. Participants compare the long run relative frequency with the known theoretical...
EngageNY
Sampling Variability and the Effect of Sample Size
The 19th installment in a 25-part series builds upon the sampling from the previous unit and takes a larger sample. Pupils compare the dot plots of sample means using two different sample sizes to find which one has the better variability.
EngageNY
Comparison Shopping—Unit Price and Related Measurement Conversions II
Which rate is greater and by how much? Pupils continue to compare rates to solve problems in the 20th portion of a 29-part series. Rates are presented in a variety of representations either using the same representation or different...
EngageNY
Understanding Box Plots
Scholars apply the concepts of box plots and dot plots to summarize and describe data distributions. They use the data displays to compare sets of data and determine numerical summaries.
EngageNY
Summarizing a Data Distribution by Describing Center, Variability, and Shape
Put those numbers to work by completing a statistical study! Pupils finish the last two steps in a statistical study by summarizing data with displays and numerical summaries. Individuals use the summaries to answer the statistical...
Bismarck Public Schools
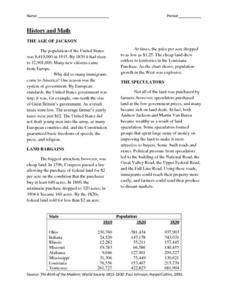
History & Math of the 1830s
Using this interdisciplinary worksheet, your young historians will have the opportunity to practice their math skills while learning about the drastic population increase in the United States during the presidency of Andrew Jackson....
EngageNY
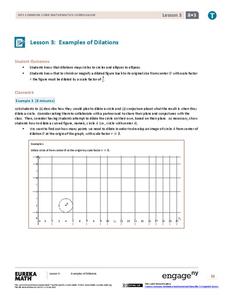
Examples of Dilations
Does it matter how many points to dilate? The resource presents problems of dilating curved figures. Class members find out that not only do they need to dilate several points but the points need to be distributed about the entire curve...
Scholastic
Study Jams! Decimal & Fraction Equivalents
If a candy bar costs 3/4 of a dollar, can your mathematicians figure out the cost in cents? After watching this animated video, your learners will see that every fraction can be a decimal and every decimal can be a fraction. The video...
Scholastic
Study Jams! Area of a Triangle
Even though there is a wide variety of different triangles in the world, knowing a single equation allows us to find the area of each and every one of them. Follow along with this step-by-step presentation as Zoe clearly models how to...
Virginia Department of Education
Quadratic Curve of Best Fit
Class members create a table of the number of chords that can be drawn given the number of points on a circle. Pupils analyze the data created, find a function to fit to it, and use the function to make further predictions.
Virginia Department of Education
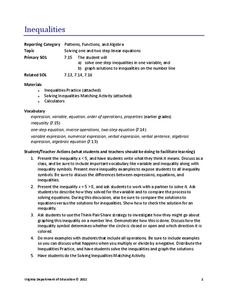
Inequalities
Not all resources are created equal — and your class benefits! Scholars learn how to solve one-step inequalities using inverse operations. They complete an activity matching inequalities to their solutions.
Virginia Department of Education
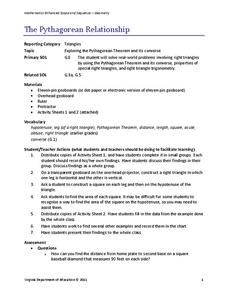
The Pythagorean Relationship
Add up areas of squares to discover the pythagorean relationship. Small groups create right triangles with squares along each side. They calculate the areas of each square and notice the relationship. Groups construct other types of...
EngageNY
Horizontal and Vertical Asymptotes of Graphs of Rational Functions
Get close to your favorite line. Scholars use end behavior to help find horizontal asymptotes. With the understanding of domains of rational functions, learners find vertical asymptotes and then use graphing calculators to verify the...
College Board
2011 AP® Calculus BC Free-Response Questions
Does the exam look pupils expected? Released free-response questions from the AP® Calculus BC exam allow teachers and pupils to see and practice with actual exam questions. Three of the questions come from the AB portion of the course...
Radford University
Transformational Graphing in the Real World: Building Bridges
No suspension here, the resource is good to go. Using graphing calculators, scholars explore how transformations affect the graphs of quadratic functions. They consider how the changes relate to the context of suspension bridges.
Flipped Math
Calculus AB/BC - Calculating Higher-Order Derivatives
Derivatives are so fun that sometimes one wants to take the derivative multiple times. The sixth of seven installments in Unit 3 - Differentiation focuses on finding higher-order derivatives. After learning about the notation, scholars...
Curated OER
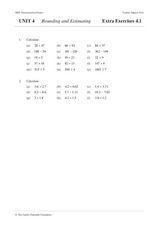
Rounding and Estimating before calculating with a Calculator
In this rounding worksheet, students solve six problem sets concerned with rounding and estimating. Students first estimate what the answer should be and then carry out the calculations using a calculator. Solutions are provided.
Curated OER
Calculator Activity: Time Flies
For this skip count worksheet, students use a calculator to help them skip count starting with the given time and finishing 60 minutes later.
Curated OER
Introduction to Limits
High schoolers practice using graphing calculators and spreadsheets as they explore numeric limits using sequences and functions. They complete a sequencing worksheet, and determine which sequence corresponds to story a story called...
Virginia Department of Education
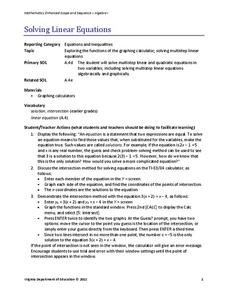
Solving Linear Equations
Practice solving linear equations by graphing. Scholars learn to solve multi-step linear equations in one variable by graphing both sides of the equation separately. They use graphing calculators to find the intersection of the graphs.
Curated OER
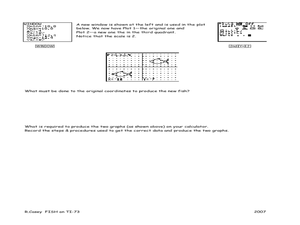
Fishing for Points
Learners explore the concept of ordered pairs. In this ordered pairs lesson plan, pupils list the ordered pairs of a graph in the shape of a fish. They use their calculator to translate the fish using lists, then translate the fish left,...
Curated OER
Determining the Point of Intersection Using the TI-83 Plus Calculator
Middle and high schoolers graph two lines and identify the point of intersection of each set of line. They use the TI calculator to help them graph and solve. There are six questions with detailed instruction on how to graph correctly.
Curated OER
In Round Numbers
Students explore the concept of rounding. In this rounding lesson, students use their calculator to round three digit numbers to the nearest 10 or nearest 100. Students round fractional numbers to the nearest tenth, hundreth, and...
Curated OER
M&M’s Math Worksheet
Who knew you could cover prediction, histograms, fractions, decimals, data collection, and averages (mean, median, and mode) all with a bag of M&M's®? Here's a fantastic set of worksheets to help you make candy a mathematical journey...


