Mathed Up!
Two Way Tables
When presented with categorical data, a two-way frequency table is a great way to summarize the information. Pupils organize categorical data using a two-way table, then use the tables to determine missing data and to calculate simple...
CK-12 Foundation
Trigonometric Functions of Angles Greater than 360 Degrees: Snowboarding
Spin through the trigonometric functions. Scholars determine the angle of rotation a snowboarding snowman makes at various distances in his jump. The class members then calculate the values of trigonometric functions for those angles.
CK-12 Foundation
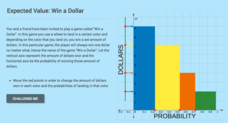
Expected Value: Win a Dollar
Spin a wheel, land on a color ... and win. Learners create a graph to display the probabilities of the amount of money they can win by spinning a colored wheel. The pupils use the dollar amounts and their probabilities to calculate the...
CK-12 Foundation
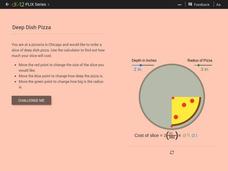
Linear Equations: Deep Dish Pizza
Explore the volume of solids with a real-life connection. Learners calculate the volume of a deep-dish slice of pizza to determine its price. They model the slice as a part of a cylinder and create a formula for calculating the cost.
Shodor Education Foundation
Pythagorean Explorer
Make sure the measurement is right. The interactive provides right triangles with a missing side measurement. Pupils use the given sides and the Pythagorean Theorem to calculate the length of the missing side. After entering the length,...
Alabama Learning Exchange
Building Functions: Reverse to Inverse
Reverse the wrapping to get to the gift. Using the idea of unwrapping a gift, the lesson introduces the concept of inverses. Pupils first determine the order needed to evaluate a function at a point, then use the reverse to find the...
101 Questions
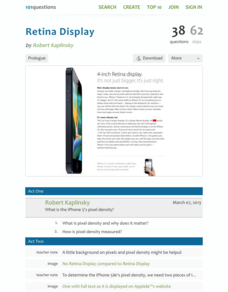
Retina Display
Learners calculate the pixel density of a specific cell phone using the concept of similarity. They use information from the cell phone's website to make their calculations and then compare their results to the posted information.
Shodor Education Foundation
Sequencer
Take the first step into graphing sequences. Learners set the starting number, multiplier, add-on, and the number of steps for a sequence. Using the inputs, the interactive calculates and plots the sequence on the coordinate plane. Users...
Illustrative Mathematics
Eight Circles
We are used to finding the area of a circle by plugging the radius into an equation. Here, learners are required to go further to find multiple areas and calculate the difference. They must detect a pattern in order to figure out the...
Illustrative Mathematics
Comparing Years
Who knew that the Egyptian, Julian, and Gregorian year were different lengths? Your mathematicians will! They will have to calculate the difference between the years in seconds and find the percent change. Using dimensional analysis,...
Illustrative Mathematics
Margie Buys Apples
One of the most common, everyday applications of math is dealing with money. This single problem calculating how much change Margie receives is more involved than it appears at first glance. An understanding of how fractions and decimals...
National Security Agency
Awesome Area - Geometry and Measurement
Break out those math manipulatives, it's time to teach about area! Capturing the engagement of young mathematicians, this three-lesson series supports children with learning how to measure the area of squares, rectangles, and other...
Illustrative Mathematics
Running Around a Track I
The accuracy required by the design and measurement of an Olympic running track will surprise track stars and couch potatoes alike. Given a short introduction, the class then scaffolds into a detailed analysis of the exact nature of the...
EngageNY
End-of-Module Assessment Task - Algebra 1 (Module 2)
Check for understanding at the end of your descriptive statistics unit with an end-of-module assessment. It uses five questions to measure progress toward mastery of descriptive statistics standards. Each question is developed...
Achieve
Yogurt Packaging
Food companies understand how to use math to their advantage. Learners explore the math related to the packaging and serving size of yogurt. They then use unit analysis and percent values to make decisions on the product development.
Willow Tree
Slope
Investigate the different types of slope using graphs and ordered pairs. Scholars use the slope formula to determine the slope of a line between two points. Includes examples with a slope of zero and with no slope. The activity follows a...
Google
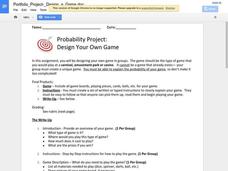
Probability Project: Design Your Own Game
Designing a game is the focus of this probability lesson. Groups develop and build a unique game, including directions for how to play, a calculation of the expected value of winning, and a personal reflection. The plan provides a...
EngageNY
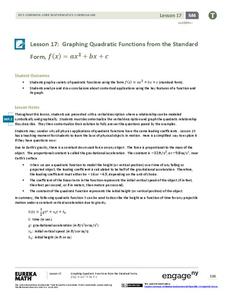
Graphing Quadratic Functions from the Standard Form
Use context to explain the importance of the key features of a graph. When context is introduced, the domain and range have meaning, which enhances understanding. Pupils use application questions to explore the key features of the graph...
EngageNY
Games of Chance and Expected Value 2
Use expected values to analyze games of chance. The 15th installment of a 21-part module has young mathematicians looking at different games involving tickets and deciding which would be the best to play. They calculate expected payoffs...
EngageNY
Making Fair Decisions
Life's not fair, but decisions can be. The 17th installment of a 21-part module teaches learners about fair decisions. They use simulations to develop strategies to make fair decisions.
EngageNY
Revisiting the Graphs of the Trigonometric Functions
Use the graphs of the trigonometric functions to set the stage to inverse functions. The lesson reviews the graphs of the basic trigonometric functions and their transformations. Pupils use their knowledge of graphing functions to model...
EngageNY
End-of-Module Assessment Task: Grade 8 Module 6
Test your knowledge of linear functions and models. The last installment of a 16-part module is an end-of-module assessment task. Pupils solve multi-part problems on bivariate data based on real-world situations to review concepts from...
EngageNY
Nonlinear Models in a Data Context
How well does your garden grow? Model the growth of dahlias with nonlinear functions. In the lesson, scholars build on their understanding of mathematical models with nonlinear models. They look at dahlias growing in compost and...
Intel
Pedal Power
Show your classes the importance of mathematics in something as simple as bicycle design. The final lesson in the six-part STEM series has each group research a different aspect of the bicycle. Learners use mathematical formulas, linear...


