Statistics Education Web
It’s Elemental! Sampling from the Periodic Table
How random is random? Demonstrate the different random sampling methods using a hands-on activity. Pupils use various sampling techniques to choose a random sample of elements from the periodic table. They use the different samples to...
Shodor Education Foundation
Triangle Area
While the lesson focuses on right triangles, this activity offers a great way to practice the area of all triangles through an interactive webpage. The activity begins with the class taking a square paper and cutting in in half; can they...
National Security Agency
Classifying Triangles
Building on young mathematicians' prior knowledge of three-sided shapes, this lesson series explores the defining characteristics of different types of triangles. Starting with a shared reading of the children's book The Greedy Triangle,...
Arizona Department of Education
Area and Perimeter of Regular and Irregular Polygons
Extend young mathematicians' understanding of area with a geometry lesson on trapezoids. Building on their prior knowledge of rectangles and triangles, students learn how to calculate the area of trapezoids and other irregular...
Visa
Cars and Loans
What's the best way to pay for a car? Should I buy used or new? Can I realistically afford a car? Pupils discover the ins and outs of buying a car, from how to shop for car insurance to the advantages and disadvantages of leasing.
Mathematics Vision Project
Module 8: Modeling Data
Statistics come front and center in this unit all about analyzing discrete data. Real-world situations yield data sets that the class then uses to tease out connections and conclusions. Beginning with the basic histogram and...
Computer Science Unplugged
Lightest and Heaviest—Sorting Algorithms
How do computers sort data lists? Using eight unknown weights and a balance scale, groups determine the order of the weights from lightest to heaviest. A second activity provides the groups with other methods to order the weights. The...
Mathed Up!
Angles
What does a geometric farmer drive? A protractor, of course! A set of assessment worksheets prompts learners to use a protractor as they measure angles, name angles, and identify lines. Use the video as a way to introduce the concepts.
West Contra Costa Unified School District
Polynomial Division
Multiply the ways your scholars can find the quotient with polynomial division. A instructional activity introduces polynomial division via long division, synthetic division, generic area model, and using the definition of division....
Statistics Education Web
Odd or Even? The Addition and Complement Principles of Probability
Odd or even—fifty-fifty chance? Pupils first conduct an experiment rolling a pair of dice to generate data in a probability lesson. It goes on to introduce mutually exclusive and non-mutually exclusive events, and how to use the Addition...
Statistics Education Web
Did I Trap the Median?
One of the key questions in statistics is whether the results are good enough. Use an activity to help pupils understand the importance of sample size and the effect it has on variability. Groups collect their own sample data and compare...
Statistics Education Web
Text Messaging is Time Consuming! What Gives?
The more you text, the less you study. Have classes test this hypothesis or another question related to text messages. Using real data, learners use technology to create a scatter plot and calculate a regression line. They create a dot...
Mathed Up!
Solving Quadratics by Factorising
Young mathematicians view a video on solving quadratic equations by factoring. They use this skill to complete a worksheet of practice problems — a great way to gauge understanding!
Mathed Up!
Reflections
Tracing paper is not just for art anymore — pupils can use it to find reflected images, too! Two videos show how to reflect images using tracing paper and find the reflection between the pre-image and image. Learners perform reflections...
02 x 02 Worksheets
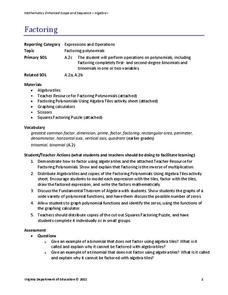
Factoring
Factor in this resource when teaching how to factor polynomials. Scholars use algebra tiles to factor linear and quadratic expressions. They practice their skill by working on example problems from a worksheet.
PBL Pathways
Biscuits
Calculate the nutrients in different types of dog biscuits. Pupils create a technical report outlining the amount of calcium, protein, and carbohydrates in three types of dog biscuits. The project-based learning activity requires...
CK-12 Foundation
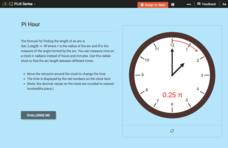
Length of an Arc: Pi Hour
What time is it when the arc length is pi? An interactive displays the measure of the angle created between the hour and minute hand of a clock. Pupils can set the clock to different hours and calculate the arc length based upon the radius.
CK-12 Foundation
Basic Trigonometric Functions: Ladder Length
Climb the ladder to trigonometry. The interactive introduces trigonometric ratios and finding lengths of sides of right triangles created by a ladder and a building. Learners use the interactive to create triangles by moving the top of...
CK-12 Foundation
Pythagorean Theorem to Determine Distance: Distance Between Friends
Pupils use an interactive to help visualize the right triangles needed to calculate distances between friends' houses. Individuals solve five problems on how to determine distances and comparing the distances.
California Education Partners
Least and Greatest
Squares can be magic. Pupils use their knowledge of addition of positive and negative rational numbers to create a 3 X 3 magic square where the sums are 1. Scholars create addition and multiplication expressions with a set of rational...
CK-12 Foundation
Vector Subtraction
Move vectors to determine their difference. Pupils use an interactive to visualize the opposite of a vector. They use the concept of adding vectors to subtract vectors by adding the opposite and, finally, view the differences of the...
CK-12 Foundation
Normal Approximation of the Binomials Distribution: When to Approximate
Normalizing a binomial distribution — determine when it is all right. Given the rule of thumb of when it is appropriate to use the normal distribution to approximate a binomial distribution, pupils look at different scenarios. Scholars...
CK-12 Foundation
Angle Measurement: Fuel Gauge Angles
Once you start looking, angles appear everywhere in our daily lives. A creative lesson has learners use the angles created by a fuel gauge to practice the Angle Addition Postulate. They see how changing the angle parts does not change...
CK-12 Foundation
Understand and Create Histograms: Histograms
Determine the shape of weight. Using the interactive, class members build a histogram displaying weight ranges collected in a P.E. class. Scholars describe the shape of the histogram and determine which measure of central tendency to use...


