CCSS Math Activities
Smarter Balanced Sample Items: High School Math – Target C
Let units pave the way to success. A set of five questions in a helpful PowerPoint presentation highlights the SBAC Claim 1 Target C high school item specifications. It covers the use of units to steer solutions, identifying appropriate...
K-5 Math Teaching Resources
Math Center Labels
From counters and calculators to pattern blocks and Unifix cubes, this collection of printable labels has exactly what you need to bring some organization to your elementary math class.
Baylor College
Food: The Math Link
Enrich your study of food science with with these math worksheets. They offer a variety of food-related word problems that are great practice for multiplying, identifying fractions, estimating length, and performing calculations...
CCSS Math Activities
Smarter Balanced Sample Items: 8th Grade Math – Claim 4
A math model is a good model. A slide show presents 10 sample items on modeling and data analysis. Items from Smarter Balanced illustrate different ways that Claim 4 may be assessed on the 8th grade math assessment. The presentation is...
CCSS Math Activities
Smarter Balanced Sample Items: 8th Grade Math – Claim 2
Math can be a problem in eighth grade. Sample items show how problem solving exists within the eighth grade standards. Part of the Gr. 8 Claim 2 - 4 Item Slide Shows series, the presentation contains eight items to illustrate the...
CK-12 Foundation
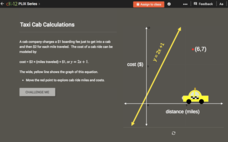
Checking Solutions to Equations: Taxi Cab Calculations
Ride to success in checking solutions to equations. Scholars use an interactive graph to identify points that are solutions to a linear equation. Interpreting these points in terms of the context completes the activity.
Curated OER
Math in English Skills II Exercise Book: Multiplication and Division
You could use this fantastic set of elementary multiplication and division worksheets in so many ways. The set is intended to support learners who require remediation or extra support in making the connection between multiplication and...
Georgia Department of Education
Math Class
Young analysts use real (provided) data from a class's test scores to practice using statistical tools. Not only do learners calculate measures of center and spread (including mean, median, deviation, and IQ range), but...
Benjamin Franklin High School
Saxon Math: Algebra 2 (Section 3)
In this third of a twelve-part series, the focus moves from using matrices to solving systems of equations with substitution and elimination, including more than two dimensions and variables in equations, and analyzing statistical data....
Illustrative Mathematics
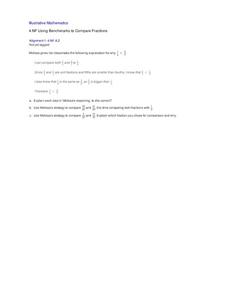
Using Benchmarks to Compare Fractions
Introduce a new strategy for comparing fractions by analyzing Melissa's use of benchmarks. Walk the class through her process, calling on students to explain their understanding of each step she took. Then practice this method on two...
EngageNY
Making Scale Drawings Using the Ratio Method
Is that drawn to scale? Capture the artistry of geometry using the ratio method to create dilations. Mathematicians use a center and ratio to create a scaled drawing. They then use a ruler and protractor to verify measurements.
Radford University
How to Calculate and Analyze the Equation for a Parabolic Path
Working in groups, pupils plot three points on the coordinate plane representing three different parabolic paths. Using a calculator, they determine the quadratic regression equation for their models. Each team then figures out the...
Flipped Math
Calculus AB/BC - Using the Candidates Test to Determine Absolute (Global) Extrema
Absolutely! Find the global maximum and minimums. Pupils watch a video showing how to find the absolute maximums and minimums of a function on an interval by testing critical points. The learners see how to determine whether a critical...
Mathematics Assessment Project
Funsize Cans
Designing fun-size cans ... what fun! Class members use the provided questions to determine the dimensions of a can with a minimum surface area for a given volume. The task allows learners to use graphs or algebraic manipulation to...
CCSS Math Activities
Smarter Balanced Sample Items: 8th Grade Math – Target H
Pythagoras is all about being right. A presentation provides sample items for how the Pythagorean Theorem standards may show up in Smarter Balanced assessments. Seven items use the Pythagorean Theorem to find the sides of a right...
University of North Texas
Math Exam 1 Review
Perfect as a review guide, this worksheet provides a range of questions focusing on functions. Topics include composing functions, transformations, domains, and polynomials. Also included are corresponding worksheets focusing on other...
Council for Economic Education
Calculating Simple Interest
How much is owed? A calculated resource introduces the simple interest formula with a video that describes how to use it. Classmates then show what they know by answering questions within a simple interest worksheet.
EngageNY
Using Tree Diagrams to Represent a Sample Space and to Calculate Probabilities
Cultivate the tree of knowledge using diagrams with two stages. Pupils create small tree diagrams to determine the sample space in compound probability problems. The lesson uses only two decision points to introduce tree diagrams.
Virginia Department of Education
Calculating Measures of Dispersion
Double the fun — calculate two measures of deviation. The lesson plan provides information to lead the class through the process of calculating the mean absolute deviation and the standard deviation of a data set. After learning how to...
Happy Maau Studios
Math Ref
Forgot how to multiply matrices? Well, this app can help. It is like a gigantic, well-organized reference card for all things math. Customize your personal reference material by adding your own notes and build up a personalized list of...
EngageNY
Describing Distributions Using the Mean and MAD
What city has the most consistent temperatures? Pupils use the mean and mean absolute deviation to describe various data sets including the average temperature in several cities. The 10th lesson plan in the 22-part series asks learners...
EngageNY
Using Sample Data to Compare the Means of Two or More Populations II
The 23rd segment in a series of 25 presents random samples from two populations to determine whether there is a difference. Groups determine whether they believe there is a difference between the two populations and later use an...
EngageNY
Describing Variability Using the Interquartile Range (IQR)
The 13th lesson in a unit of 22 introduces the concept of the interquartile range (IQR). Class members learn to determine the interquartile range, interpret within the context of the data, and finish by finding the IQR using an...
Curated OER
Calculating Sales Tax
Observe and demonstrate how to calculate state sales taxes. Learners create a sales tax chart by calculating the sales tax amount and tax inclusive retail price for school store items, then calculate the subtotals, sales tax amounts, and...


