EngageNY
Graphs of Linear Functions and Rate of Change
Discover an important property of linear functions. Learners use the slope formula to calculate the rates of change of linear functions. They find that linear functions have constant rates of change and use this property to determine if...
Virginia Department of Education
Normal Distributions
Pupils work to find probabilities by using areas under the normal curve. Groups work to calculate z-scores and solve real-world problems using the empirical rule or tables.
Cornell University
Math Is Malleable?
Learn about polymers while playing with shrinky dinks. Young scholars create a shrinky dink design, bake it, and then record the area, volume, and thickness over time. They model the data using a graph and highlight the key features of...
Teach Engineering
Start Networking!
Class members create their own social networks by collecting signatures before graphing the interactions with their fellow classmates. The degree distribution of the simulated social network is determined by calculating the degree of...
Charleston School District
Pre-Test Unit 1: Exponents
How much do you know about exponents? The pre-test covers the concepts of integer exponents with both numerical and algebraic one-variable expressions. The test is also over representing numbers in scientific notation, operating with...
Charleston School District
Pre-Test Unit 3: Functions
How does an input affect an output? Assess your learners' ability to answer this question using this pre-test. Scholars answer questions about the basics of a function. Topics include determining if a table or statement represents a...
Virginia Department of Education
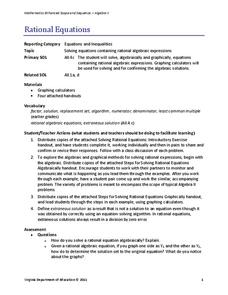
Rational Equations
Provide guidance and practice of the useful skill: solving rational equations using both an algebraic and graphical approach. Pupils solve increasingly more difficult rational equations using algebraic methods. After, they...
Virginia Department of Education
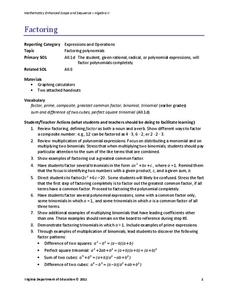
Factoring
Uncover the relationship between factoring quadratics and higher degree polynomials. Learners develop their factoring skills through repetition. A comprehensive lesson plan begins with quadratics and shows how to use the same patterns to...
College Board
2000 AP® Calculus BC Free-Response Questions
How are concepts divided? Pupils use the AP® Calculus free-response questions to see how the exam addresses concepts. The concepts are divided into those that use calculators and others that do not. Calculator items require finding...
Curated OER
Everyday Math Experiences
Students can put away the workbooks and experience a real world math day.
Teach Engineering
Household Energy Audit
Do you have an energy hog in your home? Individuals pick at least one room at home to determine the amount of energy the appliances consume. Using that information, pupils fill out a worksheet to determine the cost of running each...
Curated OER
Candy Machine
Using the concept of a candy vending machine, young mathematicians explore the sugar ratios found in different types of candy. Using the provided information, class members calculate and compare different ratios in...
Inside Mathematics
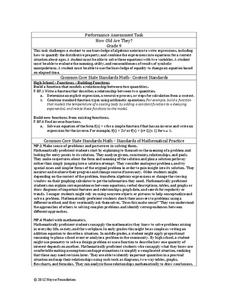
How Old Are They?
Here is a (great) lesson on using parentheses! The task requires the expression of ages using algebraic expressions, including the distributive property. Pupils use their expressions to determine the individual ages.
Inside Mathematics
Quadrilaterals
What figure is formed by connecting the midpoints of the sides of a quadrilateral? The geometry assessment task has class members work through the process of determining the figure inscribed in a quadrilateral. Pupils use geometric...
EngageNY
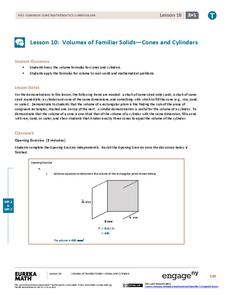
Volumes of Familiar Solids – Cones and Cylinders
Investigate the volume of cones and cylinders. Scholars develop formulas for the volume of cones and cylinders in the 10th instructional activity of the module. They then use their formulas to calculate volume.
EngageNY
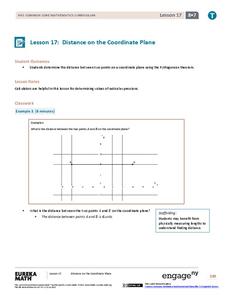
Distance on the Coordinate Plane
Apply the Pythagorean Theorem to coordinate geometry. Learners find the distance between two points on a coordinate plane by using the Pythagorean Theorem. The vertical and horizontal change creates a right triangle, which allows...
EngageNY
Estimating a Population Proportion
Find the percent of middle schoolers who want the ability to freeze time. The 21st installment in a series of 25 has groups collect a random sample of respondents who answer a question about superpowers. Using sample statistics,...
EngageNY
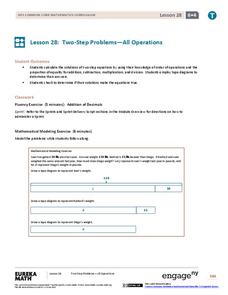
Two-Step Problems—All Operations
Step 1: Use the resource. Step 2: Watch your class become experts in solving two-step problems. Scholars learn to solve two-step word problems in context. They use tape diagrams and algebraic techniques to break the problem into two,...
Scholastic
Study Jams! Equivalent Fractions
Submarine sandwiches not only taste good, they also make for great math models. Follow along as Zoe explains how to calculate equivalent fractions, while cutting up a sandwich for herself and her friend. She demonstrates the process...
Noyce Foundation
Rabbit Costumes
How many rabbit costumes can be made? This is the focus question of an activity that requires scholars to use multiplication and division of fractions to solve a real-world problem. They determine the amount of fabric necessary for eight...
EngageNY
Modeling with Quadratic Functions (part 2)
How many points are needed to define a unique parabola? Individuals work with data to answer this question. Ultimately, they determine the quadratic model when given three points. The concept is applied to data from a dropped...
EngageNY
End-of-Module Assessment Task: Grade 7 Mathematics Module 6
Determine the level of understanding within your classes using a summative assessment. As the final lesson in a 29-part module, the goal is to assess the topics addressed during the unit. Concepts range from linear angle relationships,...
EngageNY
The Difference Between Theoretical Probabilities and Estimated Probabilities
Flip a coin to determine whether the probability of heads is one-half. Pupils use simulated data to find the experimental probability of flipping a coin. Participants compare the long run relative frequency with the known theoretical...
EngageNY
Sampling Variability and the Effect of Sample Size
The 19th installment in a 25-part series builds upon the sampling from the previous unit and takes a larger sample. Pupils compare the dot plots of sample means using two different sample sizes to find which one has the better variability.


