EngageNY
Understanding Box Plots
Scholars apply the concepts of box plots and dot plots to summarize and describe data distributions. They use the data displays to compare sets of data and determine numerical summaries.
EngageNY
Summarizing a Data Distribution by Describing Center, Variability, and Shape
Put those numbers to work by completing a statistical study! Pupils finish the last two steps in a statistical study by summarizing data with displays and numerical summaries. Individuals use the summaries to answer the statistical...
Bismarck Public Schools
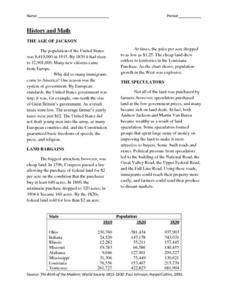
History & Math of the 1830s
Using this interdisciplinary worksheet, your young historians will have the opportunity to practice their math skills while learning about the drastic population increase in the United States during the presidency of Andrew Jackson....
EngageNY
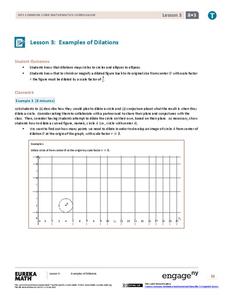
Examples of Dilations
Does it matter how many points to dilate? The resource presents problems of dilating curved figures. Class members find out that not only do they need to dilate several points but the points need to be distributed about the entire curve...
Scholastic
Study Jams! Decimal & Fraction Equivalents
If a candy bar costs 3/4 of a dollar, can your mathematicians figure out the cost in cents? After watching this animated video, your learners will see that every fraction can be a decimal and every decimal can be a fraction. The video...
Scholastic
Study Jams! Area of a Triangle
Even though there is a wide variety of different triangles in the world, knowing a single equation allows us to find the area of each and every one of them. Follow along with this step-by-step presentation as Zoe clearly models how to...
McGraw Hill
Adding and Subtracting Mixed Numbers
Adding and subtracting mixed numbers will be a breeze with this guided instructional activity packet. Learners work through examples outlining each step including rewriting mixed numbers as improper fractions, adding numerators, and...
Virginia Department of Education
Quadratic Curve of Best Fit
Class members create a table of the number of chords that can be drawn given the number of points on a circle. Pupils analyze the data created, find a function to fit to it, and use the function to make further predictions.
Virginia Department of Education
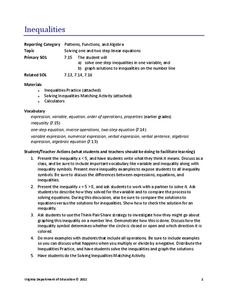
Inequalities
Not all resources are created equal — and your class benefits! Scholars learn how to solve one-step inequalities using inverse operations. They complete an activity matching inequalities to their solutions.
Virginia Department of Education
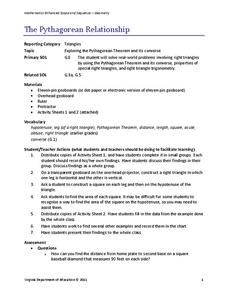
The Pythagorean Relationship
Add up areas of squares to discover the pythagorean relationship. Small groups create right triangles with squares along each side. They calculate the areas of each square and notice the relationship. Groups construct other types of...
Flipped Math
Calculus AB/BC - Calculating Higher-Order Derivatives
Derivatives are so fun that sometimes one wants to take the derivative multiple times. The sixth of seven installments in Unit 3 - Differentiation focuses on finding higher-order derivatives. After learning about the notation, scholars...
Curated OER
Batting Practice: Using Math to Calculate Baseball Statistics
Students calculate and record batting average, hits, and at bats. In this Batting Practice: Using Math to Calculate Baseball Statistics lesson, students utilize mathematical formulas to determine the career statistics of baseball player...
Curated OER
Exploring the FTC using the TI
Students use the Fundamental Theorem of Calculus to solve problems. In this calculus instructional activity, students use the TI to solve the graphing porting of the problem. They practice graphing functions and discuss their place in...
Curated OER
Determining the Point of Intersection Using the TI-83 Plus Calculator
Middle and high schoolers graph two lines and identify the point of intersection of each set of line. They use the TI calculator to help them graph and solve. There are six questions with detailed instruction on how to graph correctly.
Curated OER
M&M’s Math Worksheet
Who knew you could cover prediction, histograms, fractions, decimals, data collection, and averages (mean, median, and mode) all with a bag of M&M's®? Here's a fantastic set of worksheets to help you make candy a mathematical journey...
Curated OER
Multiplication Facts up to 10 X 10
Here is a presentation that's chock full of great tips on how to memorize multiplication facts, and how to calculate the area of shapes that aren't perfect squares or rectangles. Many good problems are in each of the slides. A great...
Teachers Network
A World of Symmetry: Math-Geometry
Define and identify the three basic forms of symmetry translation, rotation, and glides with your class. They cut out and arrange paper pattern blocks to illustrate symmetry, create a Cartesian graph, and design a rug with a symmetrical...
College Board
2017 AP® Calculus AB Free-Response Questions
What is the answer to this question? Pupils use six questions to practice for the AP Calculus AB test. The review questions are divided in two sections, calculator and non-calculator. Additional resources allow teachers to determine how...
Flipped Math
Calculus AB/BC - Average and Instantaneous Rate of Change
Ramp up the average rate of change—instantly. Learners use their knowledge of the formula to find the average rate of change to find the instantaneous rate of change. The presenter shows pupils an interactive that demonstrates finding...
Curated OER
Year 5, Term 2, Unit 7
Here is a challenging presentation which should be tough for even your top math learners. In it, pupils view 86 slides which take them through many mathematical concepts such as doubling, halving, decimals, word problems, and converting...
College Board
2009 AP® Calculus BC Free-Response Questions
Dive into the exam review. Pupils use questions, including one about diving into a pool, to prepare for the AP® Calculus BC exam. Items include contextual and non-contextual questions with contextual examples requiring a calculator....
Curated OER
Calculating Parts per Million: Do We Have a Problem Here?
Students calculate ppm and ppb by using unit analysis when given a ratio of amounts.
They determine in ppm what constitutes a health risk for a particular toxin given data
and whether local health officials should close a lake...
Curated OER
Mathematical Modeling
Study various types of mathematical models in this math lesson. Learners calculate the slope to determine the risk in a situation described. They respond to a number of questions and analyze their statistical data. Then, they determine...


