Texas Instruments
Vandalism 101
Learners explore logic and use Geometer’s Sketchpad and patterns of logic to solve a puzzle.
Illustrative Mathematics
How Many Buttons?
Bring the class into the probability by having everyone count buttons on their shirts. Organize the data into the chart provided and chose different possibilities such as "female with one button" or "all middle schoolers with more than...
EngageNY
Credit Cards
Teach adolescents to use credit responsibly. The 32nd installment of a 35-part module covers how to calculate credit card payments using a geometric series. It teaches terminology and concepts necessary to understand credit card debt.
EngageNY
Getting a Handle on New Transformations 1
In the first of a two-day lesson on transformations with matrix notation the class transforms the unit square using general transformations, then calculates the area of the transformed image. They discover it is the same as finding the...
EngageNY
Fluency with Percents
Pupils build confidence working with percents as they work several types of percent problems to increase their fluency. The resource contains two sets of problems specifically designed to build efficiency in finding solutions of basic...
Illustrative Mathematics
Sharing Prize Money
When three classrooms are to split up prize money, your mathematicians must find the percentage that each class deserves and calculate the total amount. There is an option to use a calculator and practice rounding.
Money Math for Teens
Debt Elimination - Power Tools for Building Wealth
What does it mean to be wealthy? Your learners will consider how carrying debt affects budgeting, and learn about the debt snowball strategy and how is it used in the concept of eliminating debt in order to build wealth.
EngageNY
Trigonometric Identity Proofs
Proving a trig identity might just be easier than proving your own identity at the airport. Learners first investigate a table of values to determine and prove the addition formulas for sine and cosine. They then use this result to...
California Education Partners
Miguel's Milkshakes
Moooove over, there's a better deal over there! The fourth segment in a series of eight requires individuals to determine the best unit cost for milk. Scholars calculate the least amount they can spend on a particular quantity of milk....
Beyond Benign
Municipal Waste Generation
Statistically, waste may become a problem in the future if people do not take action. Using their knowledge of statistics and data representation, pupils take a look at the idea of waste generation. The four-part unit has class members...
Curated OER
Exponential Growth versus Linear Growth II
Your algebra learners discover that exponential functions, with a base larger than one, outgrow linear functions when the inputs increase sufficiently. Their analysis includes using a graphing calculator to produce tables.
EngageNY
Polynomial, Rational, and Radical Relationships
This assessment pair goes way beyond simple graphing, factoring and solving polynomial equations, really forcing learners to investigate the math ideas behind the calculations. Short and to-the-point questions build on one another,...
EngageNY
Solving General Systems of Linear Equations
Examine the usefulness of matrices when solving linear systems of higher dimensions. The lesson plan asks learners to write and solve systems of linear equations in four and five variables. Using matrices, pupils solve the systems and...
Illustrative Mathematics
Banana Bread
Show your future bakers how to choose the right baking pan by calculating the volume of a pan. The resource compares two pans, one with decimal edge lengths and is too small for the recipe and one that may work. Your number crunchers are...
Curated OER
Rolling Twice
Rolling dice is the best way to show your learners how probability comes in to play. Although this lesson does not specify an activity, your mathematicians can try this probability with real dice to calculate their experimental...
Firelands Local Schools
Exponential Growth and Decay
How can you safely model exponential growth and decay? A hands-on activity uses candies to model not only exponential decay, but also exponential growth. Exponential equations are fitted by hand and by use of a calculator to the data...
EngageNY
Measuring Variability for Skewed Distributions (Interquartile Range)
Should the standard deviation be used for all distributions? Pupils know that the median is a better description of the center for skewed distributions; therefore, they will need a variability measure about the median for those...
EngageNY
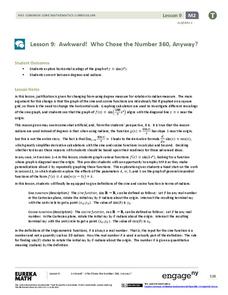
Awkward! Who Chose the Number 360, Anyway?
Don't give your classes the third degree. Use radians instead! While working with degrees, learners find that they are not efficient and explore radians as an alternative. They convert between the two measures and use radians with the...
EngageNY
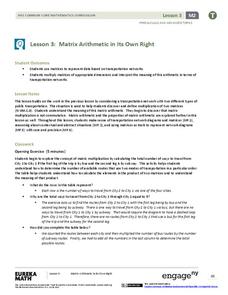
Matrix Arithmetic in Its Own Right
Matrix multiplication can seem random to pupils. Here's a instructional activity that uses a real-life example situation to reinforce the purpose of matrix multiplication. Learners discover how to multiply matrices and relate the process...
Virginia Department of Education
Simplifying Square Roots of Whole Numbers
Simplify your life by using a resource on simplifying square roots. Pupils review square roots and calculate values of given radical expressions using a calculator. The lesson plan concludes by having them consider the results to develop...
PBL Pathways
Medical Insurance
Design a plan for finding the best health insurance for your money. Learners compare two health plans by writing and graphing piecewise functions representing the plan rules. Using Excel software, they create a technical report...
CCSS Math Activities
Rolling for the Big One
Knowing math helps you win games. Learners apply conditional probability concepts in an engaging performance task. After playing a game in which players roll a 10-sided polyhedron and then try to place the digits to get the highest...
Concord Consortium
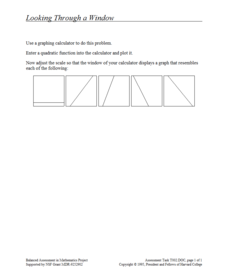
Looking through a Window
Here's a window into graphing calculators. Scholars use a graphing calculator to plot a quadratic function. They then adjust the window to make the graph look like that of a linear function and must recreate given graphs.
Statistics Education Web
When 95% Accurate Isn’t
Investigate the effect of false positives on probability calculation with an activity that asks scholars to collect simulated data generated by a calculator. To finish, participants analyze the probability of certain outcomes which lead...


