Polar Trec
How Much Data is Enough?
The next time you read a magazine or watch the news, make note of how many graphs you see because they are everywhere! Here, scholars collect, enter, and graph data using computers. The graphs are then analyzed to aid in discussion of...
Curated OER
Mean, Median and Mode
Students define mean, median, mode and outliers. In this statistics lesson plan, students analyze data using the central tendencies. They follow a path through a maze collecting data. They analyze the data using the mean, median and mode.
Curated OER
Ranging the Triple M's
Fifth graders explore collecting and analyzing data. In this mean, median and mode lesson, 5th graders use real word data to determine the mean, median and mode. Students are given sets of numbers on index cards as asked to find the...
Curated OER
Math and the NFL - Statistical Representations
Seventh graders use the Internet to get current sports information for data analysis. They use their data to find the mean, median, mode and range. Students then place their data on a spreadsheet.
Curated OER
U.S. Immigrant Statistics
Middle schoolers compare the populations of ten U.S. states to the number of immigrants who entered those states in a given year and calculate the mean, mode, and median of the grouping. They discuss why some states are more attractive...
Curated OER
The Statistics of Shoes
Students open a blank spreadsheet and format it for a class survey about the number of shoes owned by the men and women in the class. They enter the data before finding the mean, median, mode, quartiles, variance, and the standard...
Curated OER
M&M's and the Scientific Method
Sixth graders explore the scientific method by conducting an in class experiment. In this scientific averages lesson, 6th graders discuss the concept of the scientific method, and define the different mathematical averages, mean, median...
Curated OER
Measure & Evaluate Range, Mean, Median, Mode
Young scholars learn mean, median, and mode through setting up a science experiment. In this measures of central tendency lesson plan, students drop a marble into a box with 2 inches of flour and record the data. Young scholars could...
Virginia Department of Education
Exploring Statistics
Collect and analyze data to find out something interesting about classmates. Groups devise a statistical question and collect data from their group members. Individuals then create a display of their data and calculate descriptive...
Curated OER
Questioning NASA
Space science and math collide in this inquiry that investigates launching times for antacid-tablet rockets! Upper elementary or middle school learners collect data as they launch these mini rockets. They apply concepts of place value...
Curated OER
The Power of Graphical Display: How to Use Graphs to Justify a Position, Prove a Point, or Mislead the Viewer
Analyze different types of graphs with learners. They conduct a survey and determine the mean, median and mode. They then identify different techniques for collecting data.
Curated OER
Statistics of Mars
Students explore the concept of central tendencies. In this central tendencies lesson, students sort M&M's or Skittles based on color. Students graph their results. Students find the mean, median, and mode of their data.
Curated OER
Iron Oxide Lab: Incorporating Math and Science
Young scholars conduct an experiment in small groups, draw conclusions about the amount heat of a compound achieves and practice their data analysis skills.
Curated OER
C is for Cookie-A MEAN-ingful Graphing Activity
Third graders, in groups, dissect a variety of brands of chocolate chip cookies and calculate the mean for each brand. They create their own bar graphs, pictographs, and line graphs to represent information.
Curated OER
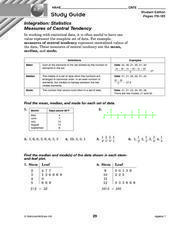
Integration: Statistics
In this math worksheet, students find the mean, median and mode for 6 number sets. Students then find the median and mode for data found in 2 stem-and-leaf plots.
Curated OER
An "Average" Golf Score
Ninth graders investigate mean, median, and mode. For this mean, median, and mode lesson, 9th graders research gold data for the top ten scores in two golf tournaments. Students make tables and graphs of the data. ...
Curated OER
Data Scavenger Hunt
Eighth graders discuss how data is collected and participate in data collection through a survey. They complete a scavenger hunt on the Internet to gain understanding of the data measures mean, median, mode, and range.
Curated OER
Making Informed Decisions Using Measures of Central Tendency
Students calculate the mean, median, mode, range, and interquartile range for a set of data. They create a box and whisker plot using paper and pencil and technology and determine which measure of central tendency is the most helpful in...
Curated OER
M&Ms; Line Plots and Graphing
Students, using small individual bags of M&Ms, engage in activities including; estimating, sorting, graphing, mean, median, mode, fractions, percentage, and averaging.
Curated OER
One, Two, Three...and They're Off
Students make origami frogs to race. After the race they measure the distance raced, collect the data, enter it into a chart. They then find the mean, median, and mode of the data. Next, students enter this data into Excel at which time...
Curated OER
Global Warming Statistics
Students research and collect data regarding temperature changes for a specific location and find the mean, median, and mode for their data. For this climate change lesson, students choose a location to research and collect data...
Curated OER
Reaction Time
Students record reaction time data and calculate minimum, maximum, mean, median, and mode. They participate in a class reaction time activity, observe and conduct an online experiment, and discuss and analyze the activity results.
Curated OER
Introduction to Measures of Central Tendency and Variability
Students calculate the mean, median, mode, range, and interquartile range for a set of data. They create a box and whisker plot using paper, pencil and technology.
Curated OER
Not Your Average Planet
Fourth graders explore median, mode, mean, and range using information about the planets and our solar system.


