Curated OER
Exploring Online Data Analysis Tools Project Interactivate- Plop It
In this data analysis worksheet, students access an online data analysis tool at the given web site. They collect name length data for classmates and enter it into the tool. The find and manipulate the data to determine how the median is...
Curated OER
Fruit Loops/Cheerios Activity: Measures of Central Tendency
In this measures of central tendency activity, students use Fruit Loops and Cheerios to gather statistical data. They find the mean, mode and median of the data. Students construct a box-and-whisker plot of the class data. This...
Centre for Innovation in Mathematics Teaching
Ten Data Analysis Activities
This thirteen page data analysis instructional activity contains a number of interesting problems regarding statistics. The activities cover the concepts of average measurements, standard deviation, box and whisker plots, quartiles,...
Curated OER
Find the Range #2
In this finding the range activity, students find the mean, median, mode, and range of each of six number sets. They write the answers in the boxes next to each label.
Math Mammoth
Stem-and-Leaf Plots 3
In this stem-and-leaf instructional activity, students place statistical data in a stem-and-leaf plot. They identify the median, and range in a given set of data. There are four multi-step problems on this one-page instructional activity.
Illustrative Mathematics
Puppy Weights
Nobody can say no to puppies, so lets use them in math! Your learners will take puppy birth weights and organize them into different graphs. They can do a variety of different graphs and detail into the problem based on your classroom...
Curated OER
Probability and Statistics - Week 10
For this probability and statistics worksheet, students find compound dependent and independent probability of given situations. They identify the mean, mode, range and median of sets. This two-page worksheet contains explanations,...
Curated OER
Nine Examples for Tables, Pictographs, Mean. Median, and Mode
In this graphical representation of data and measures of central tendency instructional activity, students calculate mean, median, and mode and answer questions related to graphs, tables, and pictographs.
Curated OER
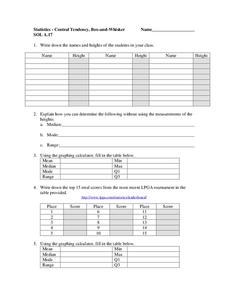
Central Tendency
In this central tendency learning exercise, students solve and complete 10 different problems that include measures of central tendency. First, they write down the names and heights of students in their class. Then, students explain how...
Utah Education Network (UEN)
Statistics
Find the value in analyzing data values. Statistics is the focus in the fifth of seven installments of the 6th Grade Math series. Individuals learn to examine dot plots, histograms, and box plots by considering the shape, mean, median,...
Curated OER
Quantitative Data
In this quantitative data learning exercise, pupils compute measures of central tendency, draw vertical line diagrams, and compare collected data. This 23-page learning exercise contains approximately 100 multi-step problems....
Willow Tree
Box-and-Whisker Plots
Whiskers are not just for cats! Pupils create box-and-whisker plots from given data sets. They analyze the data using the graphs as their guide.
Curated OER
Statistics
In this statistics instructional activity, 9th graders solve and complete 8 different problems that include various measures of central tendency. First, they find the mean, median, and mode for each set of data. Then, students find the...
Curated OER
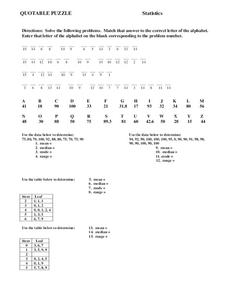
Statistics
In this statistics worksheet, 8th graders solve and complete 15 different problems. First, they solve each problem by using the data given to determine the mean, median, mode, and range for each set. Then, students match that answer to...
Curated OER
Data Analysis Self-Test
In this data analysis worksheet, students complete 1 problem that has 7 parts involving mean, median, mode, range, and quartiles. Students then perform 5 operations with matrices.
Curated OER
Averages
For this averages worksheet, students complete word problems where they find the average (sometimes called 'mean') of numbers. Students complete 10 multiple choice word problems.
Curated OER
Mean, Median, Mode and Range Sheets
In this math worksheet, students use the graphic organizer to display their answers when learning about measures of central tendency. There are 4 boxes: mean, median, mode and range.
Curated OER
Measures of Central Tendency
In this measures of central tendency worksheet, students solve and complete 6 different problems. First, they count the number of items in each set of data. Then, students determine the mean, median and mode for each. In addition, they...
Curated OER
Statistics
In this statistics worksheet, students solve and complete 6 different problems that include determining various types of statistics. First, they determine the data set where the median value is equal to the mean value. Then, students use...
Curated OER
Statistics
In this statistics worksheet, 9th graders solve and complete 10 various types of problems that include using different types of graphs to illustrate data. First, they determine the median score for each stem-and-leaf plot. Then, students...
Curated OER
Measures of Central Tendency: Pages 178-183
In this math worksheet, students find the mean, median and mode for 2 stem and leaf tables, 4 number sets. Students also find a set of numbers for given mean, median and mode.
Curated OER
Statistics
In this statistics instructional activity, 7th graders solve and complete 5 different problems related to determining various statistics. First, they find the average of a given set of numbers. Then, students find the median and mode of...
Curated OER
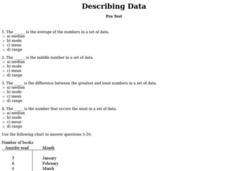
Describing Data
For this data worksheet, students complete multiple choice questions about mean, median, mode, and range. Students complete 10 questions total.
Curated OER
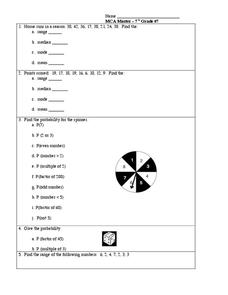
Probability and Statistics
In this probability and statistics worksheet, students complete 5 problems regarding range, mean, median, mode, and a spinner probability problem.


