Curated OER
Misleading Statistics
In this misleading statistics activity, students identify misleading graphs. They determine the mean, median and mode of given data. Students determine the measure of central tendency which accurately describes the data. This one-page...
Curated OER
Finding Range
In this range worksheet, learners enter mean, median and mode for sets of number, then enter the range.
Curated OER
Stem and Leaf Plots
In this stem and leaf plots worksheet, learners solve and complete 10 different problems that include designing stem and leaf plots. First, they use the table on the left to determine the least score and the range of the total scores...
Curated OER
"M&Ms"® Candies Worksheet 1
In this math worksheet, students find the likelihood of different outcomes with the use of M and M's candy for the seven questions and fill in the graphic organizer.
Curated OER
High School Mathematics Problems from Alaska: Fire Fighting Crew
Students apply mean, median and mode calculations of firefighter test scores to decide on hiring.
Curated OER
Challenge: Agenian Ages-Statistics
In this statistics/data worksheet, learners use given statistics of people from a fictional planet to answer 6 related questions.
Curated OER
Make and use a Stem-and-Leaf Plot
In this stem-and-leaf plot worksheet, students use a given plot to solve 4 problems, then make a plot for given data and solve related problems. Houghton Mifflin text referenced.
Curated OER
Stem and Leaf Plots
In this measures of central tendency worksheet, students study a stem and leaf plot pertaining to weekly low temperatures. Students use the plot to answer 6 questions. There will be a question that requires students to make their own...
Curated OER
Handling Data- Health Statistics
In this social studies worksheet, students organize 50 country cards into groups. Students analyze a chart and group countries according to lowest, middle, and highest Infant Mortality Rate.
Curated OER
Eight Integers and Eight Cubes
In this number puzzle worksheet, students are given 8 clues to find 8 integers. Clues refer to measures of central tendencies, abundant numbers, perfect cubes, and palindromes.
Curated OER
Algebraic Reasoning for Grade 5
In this algebraic reasoning for grade 5 worksheet, 5th graders answer 10 multiple choice questions, not interactively, about equations and operations, with answers available online.
Math Aids
Math Aids: Mean Mode Median Worksheets
Great resource to practice and strengthen math skills pertaining to mean, mode, and median. Math worksheets are printable, may be customized, and include answer keys.
Math Drills
Math Drills: Statistics and Probability Worksheets
Download these free worksheets to sharpen your skills with statistics and probability. Sheets focus on collecting and organizing data, measures of central tendency (mean, median, mode, and range), and probability.
Primary Resources
Primary Resources: Mean, Median, Mode, and Range
Here are some teacher resources to aid in teaching mean, median, mode and range. Includes worksheets, games, and PowerPoint presentations.
Math Slice
Math Slice: Statistics: Math Worksheets
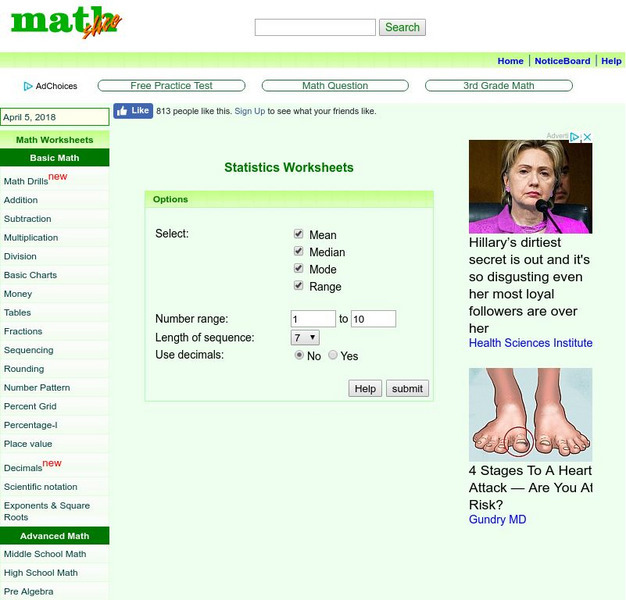
This tool allows you to create worksheets where students calculate the mean, median, mode or range of a set of numbers.


