NOAA
Investigating Sea Level Using Real Data
The news reports on rising sea level, but how do scientists measure this rise? Scholars use NOAA data including maps, apps, and images to work through five levels of activities related to sea level. Each level in the series adds a new...
Radford University
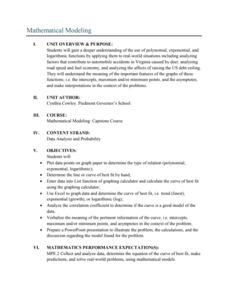
Mathematical Modeling: Lessons 2-3
Not all functions are created equal. Pupils apply regression analysis using polynomial, exponential, and logarithmic functions to investigate the relationship between variables and to decide which function would be best to model the...
Radford University
Your School’s Athletic Director Needs Your Mathematical Input!
Cover the field. Pairs investigate two different rolls of astroturf to cover a football field. The learners determine which type of roll is the most cost effective. Scholars write letters to the athletic director explaining their...
NASA
Developing an Investigation
Watch as your class makes the transition from pupils to researchers! A well-designed lesson has scholars pick a solar wind characteristic to research. They then collect and analyze official data from the LANL website. This is the third...
NASA
Revising an Investigation
Write, edit, and then revise! The fourth lesson in a five-part series asks peers to provide feedback on research. Individuals then use the research to edit and revise conclusions and develop their presentations.
Mathematics Vision Project
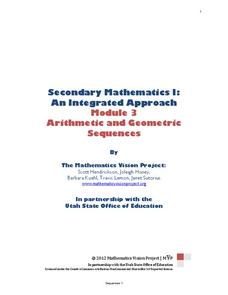
Module 3: Arithmetic and Geometric Sequences
Natural human interest in patterns and algebraic study of function notation are linked in this introductory unit on the properties of sequences. Once presented with a pattern or situation, the class works through how to justify...
Concord Consortium
Broken Spreadsheet II
Work in reverse with the product becoming the given. Using a spreadsheet image of the graph of a trigonometric function, young scholars investigate methods of creating spreadsheet data that results in the given graph. The catch? The data...
Curated OER
Investigation - Mathematical Reasoning: Tables and Chairs
Fourth graders draw pictures and diagrams as they attempt to solve a mathematical problem involving the arrangement of eleven tables shaped like equilateral triangles and the seating of exactly twenty-five people.
Curated OER
Investigation - Looking For Triangles
Seventh graders investigate a series of triangles, looking for patterns and generalizing what they have found. They analyze the pattern data and organize it into a table and graph. Students identify the relationship and discover the rule...
Curated OER
Investigating Velocity Effects at Takeoff
Young scholars use, with increasing confidence, problem-solving approaches to investigate and explain mathematical content. They make and test conjectures. They use tables and graphs as tools to interpret expressions, equations, and...
Curated OER
Investigation-How Many Toothpicks?
Seventh graders use toothpicks to investigate a series of designs and identify patterns. Data is organized and analyzed using tables and graphs, and students make generalizations using algebraic expressions.
Curated OER
Investigation- What Does It Cost?
Eighth graders investigate percents by comparing different discounts on the same sale item, practice graphing percents, and look at reasonable and unreasonable "percents off" a sale item.
Curated OER
Investigation - The Local Bagel Shop
Sixth graders investigate unit pricing to find which cup of coffee is a better buy. They use ratio and proportions to solve problems involving a change of scale in drawings, maps, recipes, etc. Students determine the unit cost of items...
Curated OER
Investigation-Looking at Polygons
Eighth graders plot points and investigate polygons. They locate a point, using ordered pairs of integers on the coordinate plane. Students compare geometric measurements and computations on coordinate axes as they are applied to...
Curated OER
Investigation - Adrienne's Pattern Block Angles
Fifth graders investigate possible solutions to a word problem. They explore properties of polygons and right angles. Students demonstrate proper angle measurement. Students discover patterns.
Curated OER
Investigation -Placing Parentheses
Seventh graders investigate placing parentheses and using the order of operations appropriately to make true sentences. They use the order of operations within a problem and the use of parentheses and their relationship by the order of...
Curated OER
Career Investigators - Jobs of Family Members
Students investigate the concept of a job and how they can differ for each household. They examine a tool box filled with different tools and identify the types of jobs could be done with them. Then the teacher conducts a class discussion.
Mascil Project
Epidemics: Modelling with Mathematics
The Black Death epidemic is responsible for more than one million deaths in the United Kingdom. An inquiry-based activity has young scholars explore the rate of disease spread. They then analyze graphs showing data from epidemics such as...
EngageNY
Buying a House
There's no place like home. Future home owners investigate the cost of buying a house in the 33rd installment of a 35-part module. They come to realize that the calculations are simply a variation of previous formulas involving car loans...
EngageNY
Scatter Plots
Scholars learn to create scatter plots and investigate any relationships that exists between the variables with a lesson that also show them that statistical relationships do not necessarily indicate a cause-and-effect relationship.
Curated OER
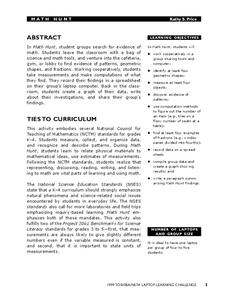
Math Hunt
Go on a scavenger hunt around your school to find evidence of math. Investigate different areas of your school for patterns, fractions, and different geometric shapes. Finally, create a spreadsheet and plot the data you've collected.
EngageNY
Copy and Bisect an Angle
More constructions! In this third installment of a 36-part series, learners watch a YouTube video on creating door trim to see how to bisect an angle. They then investigate how to copy an angle by ordering a given list of steps.
Curated OER
Rating Systems
Your favorite sports team is ranked #1. How do the powers that be determine this rating? Learn how ratings are mathematically computed using probability concepts, from the Elo Rating System for chess to the Rating Percentage Index for...
EngageNY
Trigonometric Identity Proofs
Proving a trig identity might just be easier than proving your own identity at the airport. Learners first investigate a table of values to determine and prove the addition formulas for sine and cosine. They then use this result to...


