New Zealand Ministry of Education
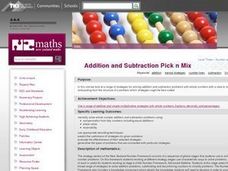
Addition and Subtraction Pick n Mix
Teach your class how to mentally solve whole number addition and subtraction problems using compensation from tidy numbers including equal additions. They use appropriate recording techniques and predict the usefulness of strategies for...
Curated OER
Cooking Lesson
Fourth graders taste different flavors on their popcorn. In this taste bud instructional activity, 4th graders make predictions about taste and dip popcorn into four different flavors. They record how the flavors tasted - sweet, salty,...
Improving Measurement and Geometry in Elementary Schools
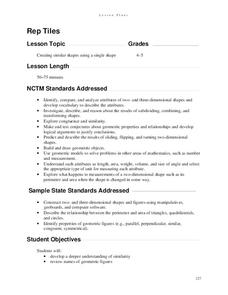
Rep Tiles
In addition to the catchy title, this lesson plan provides upper graders an opportunity to more closely scrutinize the attributes of plane figures. In particular, they focus on the similarity of different shapes. Both whole-class and...
Curated OER
Height of Bounce
Eighth graders determine the relationship between the height of bounce of a ping-pong ball and the height from which it was dropped. They are assessed on the ability to record and interpret data, graph data, make predictions, and make...
Curated OER
Math: The Cathedral Project
Second graders take a field trip to a nearby church or other historical building and examine it from a mathematical perspective. In groups, they calculate the seating capacity, describe the window patterns, differentiate types of...
Curated OER
Jelly Bean Math Activities
Using jelly beans as math manipulatives can be a tasty way to introduce and reinforce math concepts. Regardless of the time of year, candy can be used to excite learners and facilitate a wide variety of mathematical concepts.
Curated OER
Flowers, Pods, and Seeds
Students gain an understanding of living organisms. the complete a plant growth data log to chart plant growth and to make observations, predictions, and personal reflections.
Curated OER
It's About Time!
Students examine concept of time, and explore difference between analog and digital clocks; students make art project to represent time and create a time-story problem and solution.
Illustrative Mathematics
Multiples of 3, 6, and 7
What are the common multiples of three, six, and seven? Assess young mathematicians ability to find the common multiples of three numbers in a straightforward math task.
Curated OER
Bouncing Bubbles
Students complete a variety of activities exploring the joys and science of bubbles. They listen to the book "Bubbles Bubbles" by Mercer Mayer, create a bubble picture using Kid Pix, and explore blowing bubbles. Students experiment...
Teach Engineering
Ice, Ice, PV!
Knowing the temperature coefficient allows for the calculation of voltage output at any temperature. Groups conduct an experiment to determine the effects of temperature on the power output of a solar panel. The teams alter the...
National Council of Teachers of Mathematics
Cash or Gas?
Which option provides the best payout? Pupils predict which lottery prize to take. They devise a method to calculate which prize would likely provide the greatest monetary value.
Curated OER
Integration: Statistics, Scatter Plots and Best-Fit Lines
In this math worksheet, students identify the type (if any) of correlation on 6 scatter plots. They use information given on a table to create a scatter plot and identify the type of correlation. Students use the scatter plot to make...
Curated OER
The Swinging Pendulum
Students observe a pendulum and graph their observation. In this algebra instructional activity, students use the TI calcualtor to graph the motion the pendulum makes. They analyze the graph and make predictions.
Curated OER
Statistics
In this statistics learning exercise, students view 6 graphs to determine the correlation. Students then answer 4 questions that involve plotting data, determining a relationship, and making predictions.
Curated OER
A Study of a Quadratic Function
Students factor and solve quadratic equations. In this algebra lesson, students play a game as the collect and graph data. they identify properties of their parabola and make predictions.
Curated OER
Cannonball
Students calculate the speed, motion and distance of a projectile. In this geometry lesson plan, students obtain measurements while calculating velocity. They graph their results and make predictions.
Curated OER
Data and Probability- What's the Chance?
Students investigate probability through a game. In this data instructional activity, students use dice and predictions to explore how probability works.
Curated OER
The Human Line Plot
Fifth graders collect data and use charts and line plots to graph data. Through class surveys, 5th graders collect data concerning a particular subject. They graph their data using a line graph. Students make inferences and predictions...
Curated OER
Technology Literacy Challenge Grant Learning Unit
First graders explore counting and classification. They sort leaves, create graphs, write sentences for the data in the graphs, develop graphs for shapes, favorite animals, birthdays, and participate in a die prediction game.
Curated OER
Modeling Population Growth
Young scholars collect data on population growth. In this statistics instructional activity, students graph their data and make predictions. They find the linear regression and the best fit line.
Curated OER
What are the Odds
Students predict the-outcome of an event. For this algebra lesson, students compare and contrast the probability of an event occurring. They calculate the odds of a simple event and make estimation.
Curated OER
Regressive Music
Student use the Ti calculator to graph sinusoidal graphs. In this calculus lesson, students use the CBL to collect and analyze data of sinusoidal graphs. They manipulate their collected data and make predictions.
Curated OER
What are the Chances: A Game of Chance!
Sixth graders experiment with dice, playing cards, pennies and computer-generated simulations to calculate probability. They use compiled data to make predictions.


