Curated OER
Build a Skittles Graph
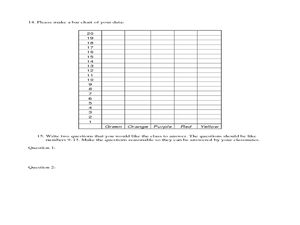
Students construct a bar graph with a given set of data. They calculate the ratio and percent of the data. Students discuss alternate ways of graphing the data as well as multiple strategies to approach the task.
Curated OER
Which Car Should I Buy?
Young scholars use gas mileage of different cars to create T charts, algebraic equations, and graphs to show which gets better mileage. In this gas mileage lesson plan, students use the graph to see which car they should buy.
Curated OER
Density Derby
Students explore the relationship between mass, volume and density. They use model boats to discover how changing mass and volume affect density. This is a very engaging instructional activity which provides great demonstrations and...
Curated OER
There's Gold in Them Thar Ratios
Students draw a model of the bunny problem which generates the Fibonacci Sequence, spirals generated from golden rectangles and golden triangles; identify the golden ratio in the human body, and find the Fibonacci numbers in nature.
Curated OER
Baseball Relationships - Using Scatter Plots
Students use graphing calculators to create scatter plots of given baseball data. They also determine percentages and ratios, slope, y-intercepts, etc. all using baseball data and statistics.
Curated OER
Buying on Credit
Students determine how buying on credit adds to the total cost of an item by computing the interest. They find a major item advertised in a magazine and identify the price. Then they identify the rate of a credit card and calculate the...
Texas Commission on the Arts
The Quarter Fold
Little ones identify the US quarter and explore the concept of one-fourth or one-quarter. Using real coins or coin manipulatives, they divide a square piece of paper into quarters, discuss halves and quarters, and create a design that...
Curated OER
Data Management and Probability: Applications
In this data management and probability applications worksheet, 7th graders solve 13 different types of problems that include finding the mean, median, mode, and range of each set of values, as well as, solving a number of word problems....
Curated OER
Build A Skittles Graph
Students explore graphing. In this graphing lesson, students sort Skittles candies and use the color groups to create a bar graph. Rubrics and extension activities are provided.
Curated OER
Global Statistics
Students determine statistics based on data. In this statistics lesson, students use data and record in charts. Students create graphs based on the statistics found.
Curated OER
Let's Go Shopping: Estimation At The Mall
Students estimate the total cost of a shopping trip. For this estimation lesson, students use three different techniques to estimate how much a shopping trip will cost.
Curated OER
Jelly Bean's Galore
Students investigate the origins of the Jelly Bean. They complete a Scavenger Hunt using the jellybean website. Pupils create a bar graph using information collected about jelly beans. Students discuss the time of year that Jelly Beans...
Curated OER
Planning for and Surviving Earthquakes
Students work in small groups to explore the FEMA for Kids site. They take the role of FEMA officials. Student list three items they may need to survive an earthquake. They complete a worksheet and discuss their results with the rest of...
Curated OER
Move My Way: A CBR Analysis of Rates of Change
Learners match a given velocity graph and sketch the corresponding position graph using a graphing calculator. After collecting data from their everyday life, students use specific functions on their calculators to create graphs and...
Curated OER
Living Room Redecoration
Fourth graders use math in a living room redecoration lesson. In this geometry lesson, 4th graders get the dimensions of a living room and need to find the amount and cost of paint and flooring. They read different scenarios and decide...
Curated OER
Bioinformatics
Students conduct a series of scientific investigation using bioinformatics. In this molecular biology activity, students collect experimental data using different educational softwares. They calculate and analyze relationships using...
Curated OER
Data, Data, Everywhere... and What Am I To Think?
Students demonstrate good random sampling techniques for data collection, select and develop graphic presentations of data and analyze the data to solve a problem presented.
Curated OER
Farming in Space
Students research, design, and run plant growth experiments online. They explore websites, design an experiment using an animation-based building block program, construct a soda bottle hydroponic production unit and a cardboard plant...
Curated OER
Anything I Can Do You Can Do Better
Middle schoolers complete a two-week unit involving design and construction concepts. They watch a PowerPoint presentation about geometric shapes, draw the fourteen shapes incorporated in bridge construction, and in small groups design,...
Curated OER
How to be a Great Navigator!
Students examine historical methods of navigation. They discuss the techniques of "Dead Reckoning," "Heaving the Log," and "Chip Log," pretend to sail from Europe to North America using vectors and determine the location of their...
Curated OER
The Effects Of Earthquakes
Students investigate the concept of how earthquakes occur and the after effects of how they effect landforms. They conduct research it using a variety of resources and measure the varying intensities of how earthquakes effect the...
Curated OER
Mean, Median, and Mode
Learners find the mean, median, and mode for a set of data. They define terms and find examples, as well as complete practice exercises. They work cooperatively to analyze real data from a variety of websites provided. To...
National Council of Teachers of Mathematics
Is It Fair?
In this probability instructional activity, learners answer nine questions about the fairness of games. High schoolers determine if a game is fair or not. They list outcomes and find ones' chances of winning.
Curated OER
Using Ratios to Taste the Rainbow
Students solve problems using ratios and proportion. In this algebra lesson plan, students analyze skittles and their different colors as they apply the properties of ratios and proportions to solve their problems.


