Statistics Education Web
Who Sends the Most Text Messages?
The way you use statistics can tell different stories about the same set of data. Here, learners use sets of data to determine which person sends the most text messages. They use random sampling to collect their data and calculate a...
Curated OER
US Airports, Assessment Variation
Determining relationships is all part of algebra and functions. Your mathematicians will decide the type of relationship between airports and population and translate what the slope and y-intercept represent. The problem is multiple...
EngageNY
Sampling Variability
Work it out — find the average time clients spend at a gym. Pupils use a table of random digits to collect a sample of times fitness buffs are working out. The scholars use their random sample to calculate an estimate of the mean of the...
Shodor Education Foundation
Sequencer
Take the first step into graphing sequences. Learners set the starting number, multiplier, add-on, and the number of steps for a sequence. Using the inputs, the interactive calculates and plots the sequence on the coordinate plane. Users...
Baylor College
Body Mass Index (BMI)
How do you calculate your Body Mass Index, and why is this information a valuable indicator of health? Class members discover not only what BMI is and practice calculating it using the height and weight of six fictitious individuals, but...
Virginia Department of Education
Heat Transfer and Heat Capacity
It's time to increase the heat! Young chemists demonstrate heat transfer and heat capacity in an activity-packed lab, showing the transitions between solid, liquid, and gaseous phases of materials. Individuals plot data as the changes...
Concord Consortium
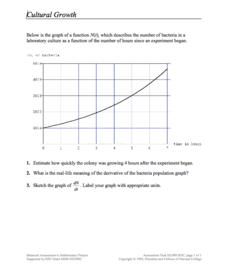
Cultural Growth
Scholars read and interpret a graph relating bacterial growth in a culture over time. They apply knowledge of derivatives, estimation, and graphing to the skill practice questions.
Statistics Education Web
The Egg Roulette Game
Hard boiled or raw? Which egg will you get? A hands-on activity has scholars explore the impact of conditional probability. Based on a skit from the Tonight Show, pupils model the selection of the two types of eggs using beads. They...
Shodor Education Foundation
Box Plot
What information can come from a box? Learners choose a data set to display as a box plot and decide whether to include the median in the calculation of the quartiles, show the outliers, and change the scale. To finish the lesson,...
Balanced Assessment
A Loud Noise
In a scale measuring noise, an increase in 10 dB is a 10 time increase in power. Mathematicians examine the data graph of a real world exponential growth, with no logarithmic scale, and then create two equations relating the decibels and...
NASA
Development of a Model: Analyzing Elemental Abundance
How do scientists identify which elements originate from meteorites? Scholars learn about a sample of material found in a remote location, analyzing the sample to determine if it might be from Earth or not. They study elements, isotopes,...
Berkshire Museum
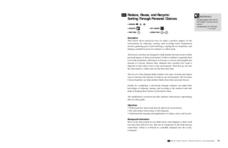
Reduce, Reuse, and Recycle: Sorting Through Personal Choices
Raise children's awareness about the importance of conservation with this hands-on science lesson plan. Start by breaking the class into groups and having them collect trash from around the school or local park. Students then use the...
Curated OER
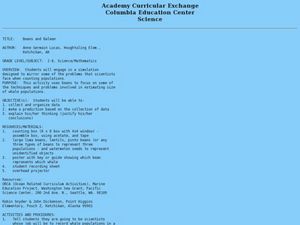
Beans and Baleen
Predict whale populations using different beans as whales! Learners observe different types of beans in a dish knowing that each bean represents a different kind of whale. They then predict how many "whales" there are in a certain area....
Curated OER
Mystery Jars
This is a twist on the old "guess how many jellybeans" game. Using estimation and math skills, learners participate in a fun "mystery jars" activity, trying to make educated guesses at how many objects are in two jars. The basic activity...
Howard County Schools
Planning for Prom
Make the most of your prom—with math! Pupils write and use a quadratic model to determine the optimal price of prom tickets. After determining the costs associated with the event, learners use a graph to analyze the break even point(s).
Curated OER
How Fast is it Traveling?
Learners calculate the rate of speed of various moving objects within the classroom setting, or outside under a controlled environment.
Curated OER
Influence and Outliers
Using the TI-Nspire calculator, statisicians identify outliers and their effect on the least-squares regression line. In finding the line of best fit, they determine what points will affect the least squares regressions and what points...
Chicago Botanic Garden
Carbon, Greenhouse Gases, and Climate
Climate models mathematically represent the interactions of the atmosphere, oceans, land, sun, surface, and ice. Part two in the series of four lessons looks at the role greenhouse gases play in keeping Earth warm and has participants...
Radford University
Throwing a Football
Use mathematics to help the football team. Pairs brainstorm how to approach finding a solution to a problem to help the quarterback complete more passes. By researching and collecting data, the teams derive an equation to represent the...
Curated OER
How's The Weather?
Students make a box and whiskers plot using the TI-73 graphing calculator. Each student would have their own calculator but they would work in small groups of two or three to help each other enter the data and make the plots.
Curated OER
Virtual Field Trip
This hands-on resource has future trip planners analyze graphs of mileage, gasoline costs, and travel time on different routes. While this was originally designed for a problem-solving exercise using a Michigan map, it could be used as a...
Curated OER
"who Lives in Your House?"
Fourth graders collect data about the people and animals living in their homes, and the students' shoe sizes. They work in groups to enter the information into a database from which they create graphs. They analyze the data to find the...
Curated OER
Interactivate - Lines, Rays, Line Segments, and Planes
Students explore lines, rays, line segments, and planes. In this math activity, students discuss the math concepts and direct their instructor in graphing functions. Students collaborate in graphing additional functions.
Curated OER
Pick a Pet
Students design informational materials to educate people on the importance of matching a new pet to the family's lifestyle and living arrangements. Students use critical thinking skills to make a decision on the appropriate choice for a...


