Curated OER
Aquatic Field Data
Students use laptops and sensors to measure water quality and graph their results. In this aquatics lesson students post their results to a website or email.
Curated OER
Graphing Real World Situations
High schoolers solve linear equations using graphs. In this algebra lesson, students depict real life situation using lines and functions. They identify the slope, data and predict graphing behavior.
Curated OER
The football and Braking Distance; Model Data with Quadratic Functions
Students use the quadratic formula to solve application problems. The first problem relates to the path of a football thrown from the top of the bleachers. Students compute the time it will take the football to reach certain heights. In...
Curated OER
Position vs. Time and Velocity vs. Time Graphs
For this constant velocity worksheet, students use data of position vs. time of a roller-skater to determine speed, acceleration, or deceleration at different points along the path. Students rank graphs according to average velocity and...
Curated OER
Populations Lab - Exponential Graphing
Ninth graders investigate the application of populations that exists in one's everyday environment, in order to develop an understanding of how mathematics is a key component in the understanding of population dynamics.
Curated OER
Dinosaur Mathematics
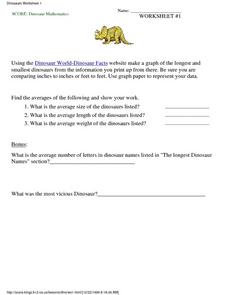
In this science and math worksheet, 5th graders answer four different questions related to dinosaurs. They graph the information with data located at a given website.
Curated OER
3-D Beginning Graphs
Students explore the concept of big and small. They collect objects from the classroom, sort them by size, and create a graph using Duplo stacking blocks.
Curated OER
Graph Your Foot!
Students measure their own foot and place the outline on a graph. They make connections between the size of their foot and the bar graph that represents it.
Curated OER
Creating a Bar Graph with a Graphing Program
Students use the S'COOL data base to create a bar graph.
Curated OER
Lining Up Data
Students examine the concept of function and make models of data and predictions based on that data.
Curated OER
Using the TI-GRAPH LINK
Middle schoolers investigate the use of the TI-Graph Link. In this middle school mathematics lesson, students explore the transfer of data from the TI-73 to the computer and vice-versa using the TI-Graph Link.
Curated OER
Bus Graph
Students make predictions about which bus takes the most/least students in the classroom. They use KidPix bus stamp for each student who goes home on that bus number and record data and discuss predictions.
Natinal Math + Science Initative
Slope Investigation
Context is the key to understanding slope. A real-world application of slope uses a weight loss scenario with a constant rate of change to introduce the concept of slope of a line, before it makes a connection to the ordered pairs and...
EngageNY
Comparing Linear and Exponential Models Again
Making connections between a function, table, graph, and context is an essential skill in mathematics. Focused on comparing linear and exponential relationships in all these aspects, this resource equips pupils to recognize and interpret...
EngageNY
Estimating Probability Distributions Empirically 2
Develop probability distributions from simulations. Young mathematicians use simulations to collect data. They use the data to draw graphs of probability distributions for the random variable in question.
Teach Engineering
Fun with Air-Powered Pneumatics
How high did the ball go? Engineering teams build a working pneumatic system that launches a ball into the air. The teams vary the amount of pressure and determine the accompanying height of the ball. An extension of building a device to...
Curated OER
Which Car Should I Buy?
Students use gas mileage of different cars to create T charts, algebraic equations, and graphs to show which gets better mileage. In this gas mileage lesson plan, students use the graph to see which car they should buy.
Alabama Learning Exchange
Jelly Beans Add Up
Students explore counting, sorting, and graphing skills. In this data analysis lesson plan, students sort jelly beans by color, count the jelly beans, and create a bar graph of the jelly beans according to color.
Curated OER
Comparing Costs
Students compare the costs of two cellular phone plans and determine the best rate. They use a table and a graph of points plotted on a Cartesian plane to display their findings. Students write an equation containing variables that could...
Curated OER
Away We Go!
Students study types of transportation. In this transportation lesson, students survey several classes to gather data on how they get to school. Students create a transportation graph.
Curated OER
Diffusion
Students design and carry out an experiment according to the scientific method. The experiment must test the effects of time and concentration on the rate of diffusion of potassium permanganate into potato cubes. After performing the...
Curated OER
Eatem Up!
Students identify, interpret and demonstrate a positive learning attitude. They identify, comprehend and use basic concepts and skills and then, communicate clearly in oral, artistic, written, and nonverbal form. Students also identify...
Curated OER
Burger King Investigation
Young scholars study data on the nutritional value of Burger King meals in order to discover its nutritional value and also to compare the meals, using mathematical computation, to the recommended daily diet. In this data handling...
Curated OER
Is Global Warming Happening?
Students investigate the probability of global warming and the effects of global warming on the environment. They conduct Internet research and collect data, transfer the data onto an Excel spreadsheet, and create a presentation that...


