Curated OER
Charting Weight
Sixth graders record the weight of themselves and 3 family over a week, and then use that data to compile 2 bar graphs and 4 line graphs and answer a series of questions.
Curated OER
Voter Turnout
Pupils solve problems using math. They complete a graph, using data from the 2000 presidential election results. Students predict and calculate the outcome of the election based upon the voting patterns.
Cheetah Outreach
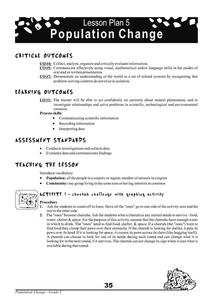
Population Change
Your youngsters become cheetahs in search of food, water, shelter, and space in a fun physical game that does a fantastic job of representing fluctuating species population based on resources available over years.
Curated OER
Vectors: Follow That Arrow
Vectors and their connection to motion. A video will be presented to provide information for the class to use methods of solving vectors with and without grids. Real-world physical concepts will be explored in reference to vectors.
Balanced Assessment
Survey Says
Examine statistical data that shows an overlap in responses. The data tallies over 100% and learners interpret this data characteristic. They then create a graph to represent the data.
Curated OER
What's Your Favorite? Survey And Graphing Project
Sixth graders create and edit spreadsheet documents using all data types, formulas and functions, and chart information. They collect and organize data that be portrayed in a graph that they create using EXCEL.
Curated OER
Graphing and the Coordinate Plane
Students gain practice reading coordinates and plotting points by participating in the Coordinates! Game. They demonstrate and test their skills with graph paper and the Maze Game.
Curated OER
Mathematical Magazines
Young scholars classify and tabulate the type of advertisements found in a collection of magazines. Determination is made on what percent of the total number of ads each type represents. They present their results orally and in a graph.
Curated OER
Mathematical Magazines
Students look through magazines and calculate the percentages of the types of ads in the magazines. In this percentages lesson plan, students create a graph to show their results.
Curated OER
Mathematical Models with Applications: The Sounds of Music
Pupils use an electronic data-collection device to model the sound produced by a guitar string. They identify the graph of a periodic situation and use the graph to determine the period and frequency of sound waves.
Curated OER
Saving Money Through Mathematics
Third graders discuss light sources and collect data about energy sources. They compare data and create a multiple line graph showing energy used by light sources for each student in the group. They present their graphs and write a...
Curated OER
Graphing Population Around the World
High schoolers define specific vocabulary necessary for understanding population data. They collect, analyze, and interpret specific data. They utilize computer programs in order to create graphs of collected data.
Curated OER
Graphing Made Easy
Fourth graders discover the appropriate way to construct and analyze bar, line, picto, and circle graphs. They set up frequency tables and perform some statistical analysis (mean, median, and mode) on their data.
Curated OER
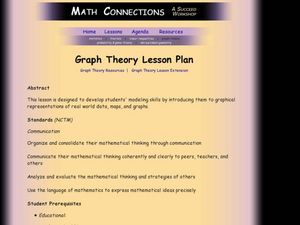
Graph Theory
Students explore the concept of graph theory. In this graph theory instructional activity, students participate in hands-on activities that enforce graph theory. Students manipulate graph applets on the internet. Students create a...
Curated OER
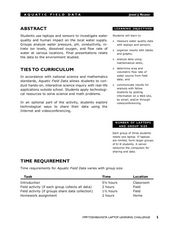
Aquatic Field Data
Students use laptops and sensors to measure water quality and graph their results. In this aquatics lesson students post their results to a website or email.
Curated OER
Graphing Real World Situations
High schoolers solve linear equations using graphs. In this algebra lesson, students depict real life situation using lines and functions. They identify the slope, data and predict graphing behavior.
Curated OER
The football and Braking Distance; Model Data with Quadratic Functions
Students use the quadratic formula to solve application problems. The first problem relates to the path of a football thrown from the top of the bleachers. Students compute the time it will take the football to reach certain heights. In...
Curated OER
Position vs. Time and Velocity vs. Time Graphs
For this constant velocity worksheet, students use data of position vs. time of a roller-skater to determine speed, acceleration, or deceleration at different points along the path. Students rank graphs according to average velocity and...
Curated OER
Populations Lab - Exponential Graphing
Ninth graders investigate the application of populations that exists in one's everyday environment, in order to develop an understanding of how mathematics is a key component in the understanding of population dynamics.
Curated OER
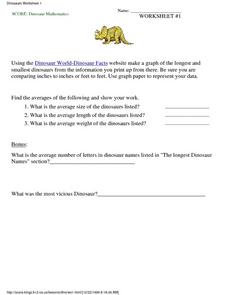
Dinosaur Mathematics
In this science and math worksheet, 5th graders answer four different questions related to dinosaurs. They graph the information with data located at a given website.
Curated OER
Bird Pictogram Page 2
In this math worksheet, students examine a pictogram which shows the 4 most common foods of wild birds. Students analyze the pictogram and answer 8 questions about the data displayed.
Curated OER
3-D Beginning Graphs
Students explore the concept of big and small. They collect objects from the classroom, sort them by size, and create a graph using Duplo stacking blocks.
Curated OER
Graph Your Foot!
Students measure their own foot and place the outline on a graph. They make connections between the size of their foot and the bar graph that represents it.
Curated OER
Creating a Bar Graph with a Graphing Program
Students use the S'COOL data base to create a bar graph.


