Curated OER
How Toxic Is It?
Students participate in an activity in which they investigate the scientific method and seed germination as well as practice graphing and metric measuring skills. Students examine toxicity by exposing Wisconsin Fast Plants seeds to toxic...
Howard County Schools
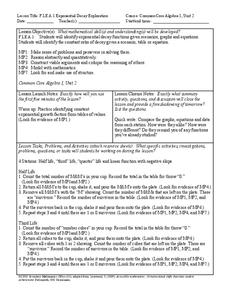
Exponential Decay Exploration
How can you model exponential decay? Explore different situations involving exponential decay functions and decreasing linear functions by performing activities with MandM candy, popcorn kernels, and number cubes.
Curated OER
Discovering Growth Patterns
Students explain the differences between linear (arithmetic) and exponential (geometric) growth. They use worksheets imbedded in this lesson to help them make predicitions and graph data points.
Curated OER
Disease Lesson
Ninth graders examine rates, matrices, histograms, line graphs, data analysis and data presentation in order to develop an understanding of how these concepts apply to a the effects of a specific disease.
NASA
Newton Car
If a car gets heavier, it goes farther? By running an activity several times, teams experience Newton's Second Law of Motion. The teams vary the amount of weight they catapult off a wooden block car and record the distance the car...
Curated OER
Height of Bounce
Eighth graders determine the relationship between the height of bounce of a ping-pong ball and the height from which it was dropped. They are assessed on the ability to record and interpret data, graph data, make predictions, and make...
Curated OER
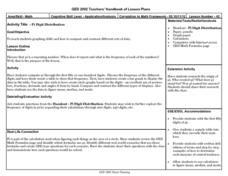
Pi Digit Distribution
Students study graphing skills and compare and contrast data sets. They compute pi through the first 50-100 digits and create a bar graph showing the frequencies of specific digits.
Curated OER
A Study of a Quadratic Function
Young scholars factor and solve quadratic equations. In this algebra lesson, students play a game as the collect and graph data. they identify properties of their parabola and make predictions.
Curated OER
Iterating Linear Functions
Students use a spreadsheet to investigate data. In this algebra lesson, students collect and graph data on a coordinate plane. They explain properties of a linear equation both algebraically and orally.
Curated OER
Unit 2 Worksheet 4-Motion
In this motion learning exercise, students analyze motion maps and construct graphs using the data. They write mathematical expressions to show the relationship of velocity versus time and position versus time. They determine...
Curated OER
Three Little Kittens: Addition Booklet
Young scholars explore math problem solving strategies while reading a nursery rhyme. In this addition lesson plan, students learn math skills such as solving simple equations, graphing data and extending patterns while reading The Three...
Curated OER
Family Survey
In this mathematical worksheet, students survey fifteen people to find out how many people are in their family and then graph out their findings.
Curated OER
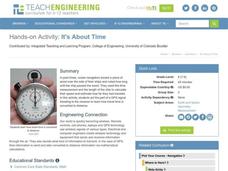
It's About Time
Middle schoolers investigate how Global Positioning Systems work and how and why GPS receivers make errors. They graph data points and apply estimation and prediction to real-life GPS situations, discuss time delay, and complete a...
Curated OER
Developing the Concept: Rates
Learners discover how to use the knowledge of unit rates to understand equivalent ratios and solve real-world problems. They are given word problems to solve using equivalent ratios. Tables are also covered in this resource.
Curated OER
Year 5, Term 2, Unit 9 - Day 1
A well-designed presentation can help your class with a variety of mathematical concepts. Pupils practice many different computational skills, such as addition, subtraction, finding multiples of 10, working with decimals, and solving...
Kenan Fellows
Density
Most scholars associate density with floating, but how do scientists determine the exact density of an unknown liquid? The third lesson in a seven-part series challenges scholars to find the mass and volume of two unknown liquids. Each...
Curated OER
Living in the Desert
Conduct an investigation on the plants used by the Hohokam tribe. To survive in the harsh desert environment the Hohokam used many natural resources. Learners read, research, map, and graph multiple aspects of Hohokam plant use as a...
Curated OER
Tracking the Salt Front
Using the Hudson River as the focus, learners discuss the difference between salt water and fresh water environments, analyze maps and graphs, and complete addition and subtraction problems. This activity comes with a wealth of...
Curated OER
Vacation Values: A Math WebQuest
Fifth graders participate in a Math Web Quest to research two vacation options for their "families" in order to determine the best mathematical value for their family. They gather data, create two comparison graphs based on that data,...
Curated OER
Foxes and Rabbits 3
Use realistic data to find trigonometric models that best fit the populations of foxes and rabbits in a national park. Included are detailed explanations of the answers and process. This is a follow-up exercise to the lesson listed in...
Curated OER
Math Hunt
Go on a scavenger hunt around your school to find evidence of math. Investigate different areas of your school for patterns, fractions, and different geometric shapes. Finally, create a spreadsheet and plot the data you've collected.
Curated OER
Unit II: Worksheet 3 - Velocity
Future engineers analyze the motion of Robin, the roller skater, as he moves along a sidewalk. They graph the position versus time for three different occurrences. Questions are asked about the resulting graphs, reinforcing the concepts...
Curated OER
Taxi!
Your young taxi drivers evaluate and articulate the reasoning behind statements in a conceptual task involving linear data. The given data table of distances traveled and the resulting fare in dollars is used by learners to explore...
Statistics Education Web
Double Stuffed?
True or false — Double Stuf Oreos always contain twice as much cream as regular Oreos. Scholars first measure the masses of the filling in regular Oreos and Double Stuf Oreos to generate a class set of data. They use hypothesis testing...


