Curated OER
Introduction to Linear Functions
Students are introduced to the concept of linear functions. Using new terminology, they describe linear functions in sentences and in data tables. Using the internet, they calculate and record answers to problems which are discussed...
Curated OER
Global Statistics
Students select appropriate data to determine the mean, median, mode and range of a set of data. They calculate the statistical data on literacy rates and life expectancy within each geographic region of the world. Students determine...
Curated OER
Integration: Statistics, Scatter Plots and Best-Fit Lines
In this math worksheet, learners identify the type (if any) of correlation on 6 scatter plots. They use information given on a table to create a scatter plot and identify the type of correlation. Students use the scatter plot to make...
Curated OER
Holey Clamshells
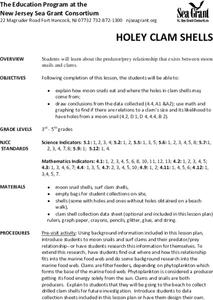
Students analyze data to make hypotheses and conclusions regarding the predator/prey relationship between moon snail and surf clams.
Curated OER
Cold Enough?
Students read and record temperatures and display the data. They represent the temperatures on an appropriate graph and explain completely what was done and why it was done. Students display the data showing differences in the daily...
Curated OER
Patterns In Hexagon Tables
Sixth graders construct a rule about the number of sides found in a pattern of hexagons. In this mathematical problem solving lesson, 6th graders observe different hexagon patterns and create a rule about the relationship between the...
Curated OER
Earthquakes
Eighth graders demonstrate the mathematical components of a scientific problem as well as illustrate how real world problems can be solved using math. They demonstrate math skills such as rate calculation, graphing, and linear equations.
Curated OER
Geometric Transformations
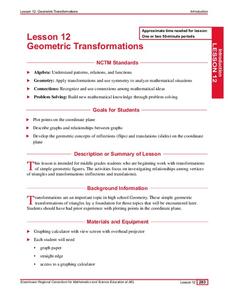
Students solve problems involving transformations of geometric figures. They review graphing points in the coordinate plain, plot points and connect to create a triangle. Then, they reflect triangles over the x and y axis and use...
Curated OER
Statistics and Shopping
Students explore the concept of using consumer data and statistics to aid in the consumer decision making process. In this consumer data and statistics lesson, students research consumer data and statistics. Students analyze the data...
Curated OER
Range and Mode
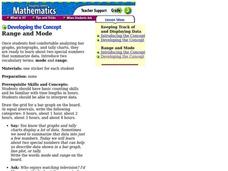
Fifth graders interpret data. In this mode and range lesson plan, 5th graders define mode and range and practice finding them given a set of data.
Curated OER
An Introduction to Functions
Learners investigate the growth and decay of an exponential function. In this algebra instructional activity, students apply properties of exponent solve problems. They identify any patterns they see in the graphs.
Utah LessonPlans
Seed Sort
Students form a variety of categories for seed mixes (wild bird seed or 15 bean soup) and create graphs to display their categories.
Curated OER
Fractions, Decimals, and Percents
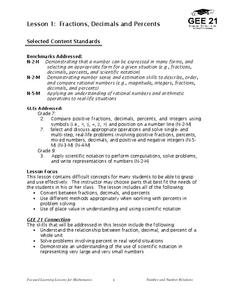
Students connect different mathematical concepts. They create a circle graph. Students then create a question in which they collect data in order to convert fractions to decimals and decimals to percents.
Curated OER
Probability With a Random Drawing
Students define probability, and predict, record, and discuss outcomes from a random drawing, then identify most likely and least likely outcomes. They conduct a random drawing, record the data on a data chart, analyze the data, and...
Curated OER
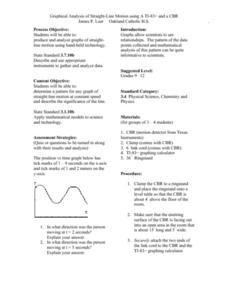
Graphical Analysis of Straight-Line Motion
Students investigate the concept of straight line motion. They determine the pattern and graph it looking for the motion maintained at a constant speed. Students also write a description of the significance of the line. The skill of...
Curated OER
I'm a Weather Watcher Watching plants grow by......my,my,my
Students investigate how weather affects how plants grow. They collect data on weather and plant growth for a week and display the data on a graph. For a culminating experience they design a movie using software that shows plant growth...
Curated OER
Leap Into Exponential Functions
Students use properties of exponents to solve equations. In this algebra lesson, students add, subtract, multiply and divide exponential functions. They graph and differentiate between exponential growth and decay.
Curated OER
Party, Party, Party
Second graders conduct investigations with counting, comparing, organizing, analyzing, displaying and interpreting data. They pose questions for investigation and collect the data. Students display the data in tally charts, uniform...
Curated OER
Connecting Measurement
Students participate in activities the connect measurement to geometry, statistics, estimation, and the real world. They collect measurements from their elbow to the tip of their middle finger and make a box plot of the data as well as...
Curated OER
Ohio Census 1990 and 2000
Students explore the Ohio census numbers in 1990 and 2000. In this social studies lesson, students use the census data to answer questions.
Curated OER
Measuring to the Nearest Inch
Third graders use whole numbers and fractions to make connections between abstractions of the mathematical world and the real world. In this fractions and measurement lesson, 3rd graders identify, quantify groups , and measure distances....
Curated OER
Pop Clock
Pupils review the Census Bureau's Homepage, gather information regarding population trends in order to make predictions on future populations.
Curated OER
Skittles Lab
Students use Skittles as manipulatives to practice computing decimals from fractions, computing decimals into percentages, and creating bar graphs from gathered data.
Curated OER
Eratosthenes And Radius of the Earth
Learners calculate the radius of the earth. They use the method and data suggested by Eratosthenes. They investigate the interrelationships among mass, distance, force, and time through experimental processes.


