Curated OER
Box Plots on the TI-83 Calculator
Eighth graders research box plots on the Internet. They gather real life statistics and analyze the collected statistics by making multiple box plots on the TI-83 calculator.
Curated OER
What I Didn't Know...
Students practice creating wikis. In this wiki instructional activity, students create a wiki about any math topic that they know nothing about. Students learn about their topic and create a wiki that explains the math topic in detail.
Curated OER
Probability: The Study of Chance
Students practice the basic principles of probability by conducting an experiment, determining if a game is fair, collecting data, interpreting data, displaying data, conducting analysis, and stating and applying the rule for probability.
Curated OER
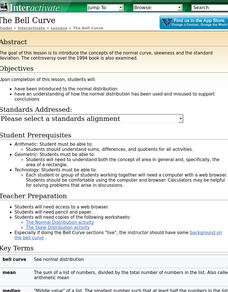
The Bell Curve
Students are introduced to the normal distribution and examine the bell curve controversy.
Alabama Learning Exchange
The State Capital of Stem and Leaf
Students explore the concept of stem and leaf plots. In this stem and leaf plots lesson plan, students plot the 50 US states' capitals on a stem and leaf plot according to the first letter of each state. Students compare their stem and...
Curated OER
The Statistics Sampler
Students define sample, describe a random sample, and discuss what compromises a sample. They determine a sample size to estimate a population characteristic with confidence.
Curated OER
Perplexing Patterns
Seventh graders identify and find missing patterns. In this algebra instructional activity, 7th graders investigate numbers and sequences and complete the pattern. They make a chart and discuss similarities and differences.
Curated OER
The Dog Days of Data
Students practice an alternative form of data presentation. They practice sequencing data, identifying the stem-and-leaf, creating stem-and-leaf plots, and drawing inferences from the data by viewing the plots.
Curated OER
The Dog Days of Data
Learners are introduced to the organization of data This lesson is designed using stem and leaf plots. After gather data, they create a visual representation of their data through the use of a stem and leaf plot. Students
drawing...
Curated OER
Macbeth Madness
Students research Macbeth online and complete computer and graphing activities for the play. In this Macbeth activities lesson, students research Macbeth and bookmark the URL's. Students complete activities for the topic on spreadsheets...
Curated OER
Graph and Compare the Adventure's Temperature Vs. Local Temperature
Students explore the concept graphing data. In this graphing data lesson, students use weather data from their local weather and some other city and graph them. Students plot the local weather vs. another city. Students record...
Curated OER
Listen to Your Heart
Sixth graders explore how exercise affects heart rate and use spreadsheets to record and analyze data.
Curated OER
Time For Breakfast
This unit encourages students to assess the validity of a set of statements and then plan and carry out investigations to find out whether the statements are true. Students then carry out statistical investigations of their own.
Curated OER
Measures of Spread
Students explore the concept of measures of spread. In this measures of spread lesson, students calculate the standard deviation for a set of data. Students use the standard deviation to analyze and describe the set of data. Students...
Curated OER
Measuring "pHacts" about Acid Rain
Sixth graders gather and graph information regarding the pH of rain. Working cooperatively with an internet partner, 6th graders gather and record information about the pH of the rain in their local area. They graph this information...
Curated OER
Water You Can Use from the Air Conditioner
Students work together to research water quantity, quality and safety standards. They complete a lab to discover how to use the water from an air conditioner. They write a paper to show their findings.
Illustrative Mathematics
Illustrative Mathematics: S Id.3 Describing Data Sets With Outliers
For certain data sets, such as home prices and household or individual income, is often described using the median instead of the mean. This lesson explores the mean and median in some different situations to help you understand the...
Illustrative Mathematics
Illustrative Mathematics: 6.sp4, 5c Puzzle Times
A performance task asking students to create a graph of provided information and then find the mean and the median of the data.
University of Texas
Inside Mathematics: Baseball Players [Pdf]
This task challenges students to demonstrate understanding of the concept of measure of center.
Alabama Learning Exchange
Alex: Estimation Station
During this lesson, students will learn the difference between estimation and guessing. Knowing how to estimate is an essential skill that will help students determine approximate totals as well as check the reasonableness of their...
Illustrative Mathematics
Illustrative Mathematics: 6.sp Puppy Weights
A performance task asking students to create a graph of provided information and then answer two questions about the information provided with that graph.


