Curated OER
The Number Line
Learners graph and order numbers using a number line. They also solve word problems using fractions and decimals and rewrite equations to solve problems correctly. Several example word problems are given.
Teach Engineering
Bone Density Math and Logarithm Introduction
What do logarithms have to do with bone density? Scholars learn that the equation for bone density includes logarithms. The majority of the third lesson of seven is devoted to logarithms and their properties.
Curated OER
Algebra...Your Second Language
Help learners translate word problems into algebraic equations. They will rewrite words using symbols and evaluate algebraic expressions using real life scenarios, animation sequences, video presentations, and activities to help students...
Alabama Learning Exchange
Comparing Fuel Economy
Compute fuel economy and gas mileage. Why? So you can teach rates and ratios, of course! Middle schoolers calculate the rate of miles per gallon for various vehicles. They research each vehicle, its mileage per gallon, and cost per...
Curated OER
Measurement: 2D and 3D
Students solve volume problems. In this geometry lesson, the class watches a video about clean water (link provided) and individuals compare the volume of different prisms, including an actual drinking glass. Extension activities include...
Curated OER
Skipping Into Multiplication
Young mathematicians study the relationship between skip counting and multiplication. They build on skip counting skills and examine arrays while studying multiplication. Resources are provided.
Curated OER
Chances Are......You're Right
Young mathematicians study probability. In this math lesson, learners calculate odds, and convert those into percentages of probability. Fractions are also used, making this lesson quite rich in some of the more difficult conversions...
Curated OER
Compound Inequalities and Graphing
Put geometry skills to the test! Learners solve compound inequalities and then graph the inequalities on a coordinate plane using their geometric skills. They identify the slope and y-intercept in order to graph correctly. I like this...
Curated OER
Applying Algebra to the Life of Middle Schoolers
Middle schoolers will read word problems, create questions, and come up with solutions. They are taught to use previous knowledge combined with current content to solve problems logically and algebraically.
Shodor Education Foundation
InteGreat
Hands-on investigation of Riemann sums becomes possible without intensive arithmetic gymnastics with this interactive lesson plan. Learners manipulate online graphing tools to develop and test theories about right, left, and midpoint...
Curated OER
Graphing Systems of Inequalities
Solve equations and graph systems of inequalities. Designed as a lesson to reinforce these concepts, learners revisit shading and boundaries along with solving linear inequalities.
Curated OER
"A Slice of the Cone"
Here is a set of lessons that explore conics in a number of different ways. Starting with modeling how a conic is produced by the way a plane cuts the cone, to solving complex word problems, algebra learners progress through a series of...
EngageNY
Average Rate of Change
Learners consider the rate of filling a cone in the 23rd installment of this lesson series. They analyze the volume of the cone at various heights and discover the rate of filling is not constant. The lesson ends with a discussion of...
Curated OER
Prime and Composite Numbers
Prime and composite numbers are the focus of this mathematics lesson. In it, learners practice techniques for identifying these two types of numbers. They utilize the Inspiration program to complete a task that is clearly explained, and...
Curated OER
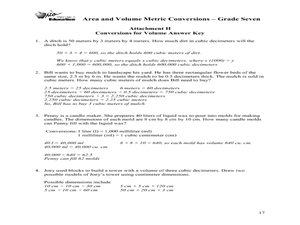
Area and Volume Metric Conversions - Grade Seven
Students investigate unit conversion. For this unit conversion lesson, students will build models of square and cubic centimeters using grid paper and generate formula tables for converting units of area and volume. The tables will be...
Curated OER
Linear and Quadratic Model, Data Modeling
Students model quadratic and linear equations. In this algebra lesson, students solve word problems using equations. They create scatter plots and make predictions using correlations.
American Statistical Association
Scatter It! (Predict Billy’s Height)
How do doctors predict a child's future height? Scholars use one case study to determine the height of a child two years into the future. They graph the given data, determine the line of best fit, and use that to estimate the height in...
Curated OER
Poly-Mania
This hands-on lesson takes young geometers on a tour of 2D polygons and 3D polyhedrons. After exploring different web resources and discussing geometric shapes, small groups construct models of polyhedrons using bendable straws. Note:...
Curated OER
Fractions, Decimals, and Percentages Got You Down? "Tri" This!
Students explore number sense by creating a math presentation in class. In this parts of a whole lesson, students define and discuss the relationship between fractions, decimals and percentages before completing a problem worksheet in...
Scholastic
Adding and Subtracting Ten
Developing fluency with basic addition and subtraction is fundamental to the success of all young mathematicians. This four-day lesson series begins with learners using ten-frames and hundreds charts to recognize patterns when adding and...
Statistics Education Web
The United States of Obesity
Mississippi has both the highest obesity and poverty rate in the US. Does the rest of the data show a correlation between the poverty and obesity rate in a state? Learners tackle this question as they practice their skills of regression....
Mascil Project
Container Logistics
Here's a creative lesson that lets pupils be creative as well! While considering many different factors, learners devise a plan to increase the efficiency of container shipments. The design of the activity encourages creative,...
American Statistical Association
A Sweet Task
Candy is always an effective motivator! A fun math activity uses M&M's and Skittles to explore two-way frequency tables and conditional probability. The candy can serve a dual purpose as manipulatives and experimental data.
NASA
Lights on the International Space Station
Groups explore illumination with NASA's Lighting Environment Test Facility (LETF) as a context. Using the TI-Nspire app, groups determine the lux equation that models their simulation. They then use the lux equation to solve problems...


