Shodor Education Foundation
Plop It!
Build upon and stack up data to get the complete picture. Using the applet, pupils build bar graphs. As the bar graph builds, the interactive graphically displays the mean, median, and mode. Learners finish by exploring the changes in...
Curated OER
Identifying Different Types of Graphs
This is an outstanding presentation on graphs and statistics. Learners choose which type of graph is being shown, and also gain practice in the techniques used to find the mean, median, and mode of sets of numbers. Very good!
Curated OER
Drops on a Penny
Young scientists explore the concept of surface tension at is applies to water. In this activity, learners use a dropper to place drops of water on a penny. Each group guesses how many drops a heads-up penny will hold, then conducts the...
Curated OER
Quiz: Mean, Median, Mode, and Range
Use this measure of central tendency worksheet to have learners find mean, median, mode and range of ten sets of nine numbers. Numbers are presented in a series of lists.
Illustrative Mathematics
Electoral College
A cross-curricular resource that takes the electoral votes and allows your learners to organize and analyze the data. Young voters can determine which states are more influential and interpret the dotplot provided for more data....
Curated OER
Means, Medians, and Modes
In this math worksheet, students find the mean, median, and mode for each set of numbers. Then they apply the methods to the word problems.
Curated OER
Using mean, median, and mode
In this mean, median, and mode activity, learners read how to use each method and then complete problems using each one. Students complete 8 problems.
Curated OER
Mean, Median, and Mode
Fifth graders compute the mean, median, and mode of sets of numbers.
Curated OER
Candy Colors: Figuring the Mean, Median, and Mode
Students count candy by color and then calculate mean, median, and mode. They count candy and use the data to calculate mean, median, and mode (by color) and apply their learning to another collection of data.
Curated OER
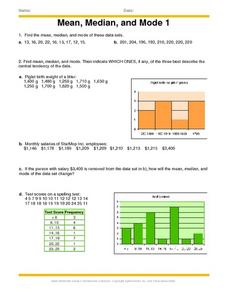
Mean, Median And Mode 1
In this mean, median and mode worksheet, learners problem solve and calculate the answers to ten word problems associated with the mean, median and mode of collected data.
Curated OER
Mean, Median and Mode
In this mean, median and mode worksheet, students solve 6 problems involving mean, median and mode. Students are given a "hint" for problems 1 and 2.
Curated OER
Tackling Mean - Median and Mode
Second graders wear a favorite sports jersey to school. They calculate the mean, median and mode of the numbers represented on the jerseys. They present and explain their calculations to the class.
Curated OER
Mean, median, and mode... Use the data
Ninth graders participate in a lesson focused on the concept of basic statistics. They find the mean, median, and mode of different data sets. More advanced students could practice creating a bell curve from the data.
Curated OER
Mean, Median, and Mode
For this mean, median, and mode worksheet, students find the mean, median, and mode for 4 sets of numbers and answer short answer questions about them. Students answer 5 short answer questions.
Curated OER
Mean, Median, and Mode for Frequency Tables
In this mean, median, and mode worksheet, students solve 10 short answer problems. Students find the mean, median, and mode of various data sets. Students make frequency tables from the data sets.
Curated OER
Super Ticket Sales
Use this graphing data using box and whisker plots lesson to have learners make box and whisker plots about ticket sales of popular movies. They find the mean, median, and mode of the data. Pupils compare ticket sales of the opening...
Curated OER
What's Your Average? What Do You Mean? I'm More Than Just Average
Upper grade and middle schoolers collect data, analyze and interpret the data. This three-part activity should provide learners with a firm understanding about the differences between mean, median, and mode and how to perform the...
Curated OER
Mean, Median, Mode, and Range
In this mean, median, mode, and range instructional activity, students define and solve 5 detailed questions that include finding the mean, median, mode, and range of numbers. First, they calculate the mean, median, mode, and range for...
Curated OER
Mean, Median, Mode and Range
Fourth graders investigate when to find the mean, median, mode and range. In this statistical concepts activity, 4th graders collect data, make observations and graph the data. Students verify their work on the computer.
Mathed Up!
Mean, Median, Mode, and Range
Learners read a variety of word problems and find the mode, median, range, and mode from a given set of data. If calculators are not desirable, provide the class with notebook paper to work out the equations.
Curated OER
Word Problems That Involve the Mean (II)
In this word problem worksheet, students examine real world problems. They compute the mean, median, and mode of given problems. This one-page worksheet contains 5 multi-step problems. Answers are provided.
Curated OER
Maps and Modes, Finding a Mean Home on the Range
Fifth graders investigate data from maps to solve problems. In this data lesson, 5th graders study maps and collect data from each map. Students present their data in a variety of ways and calculate the mode, mean, median, and range.
Curated OER
Madley Brath #39 - Stem and Leaf Plots, Mean, Median, Mode and Range
In this measures of central tendency worksheet, students draw a stem and leaf plot of a set of test scores. They compute the mean, median, mode, and range of the data set, and round the answers to the nearest tenth.
Curated OER
Find the Mean, Median, Mode & Range
In this numbers worksheet, students study 6 different sets of numbers. Students, for each set of numbers, find the mean, median, mode and range. Students put their answers in the boxes provided.


