Curated OER
Observing the Evidence
Fifth graders explore how to do research from a large group. They explore how to choose a representative sample and collect data from it.
Curated OER
Aging & Body Changes
Young scholars complete several activities that have to do with aging. In this body changes lesson students take group averages, measure flexibility and see their changes over time.
Curated OER
America's Pastime
Students relate Newton's Laws of Motion to the game of baseball. They compare and contrast the materials used in baseballs that could affect their performance. They also determine how friction can be increased or decreased in a ballpark.
Curated OER
Dealing with Data
Seventh graders collect and analyze data. In the seventh grade data analysis lesson plan, 7th graders explore and/or create frequency tables, multiple bar graphs, circle graphs, pictographs, histograms, line plots, stem and leaf...
Curated OER
Closing the Case
Fifth graders collect data and prepare data displays using a survey with statistical information.
Curated OER
Our Class Record Book
Second graders, in groups, prepare a list of proposed record ideas for the class book.
Curated OER
Using Statistics to Uncover More Evidence
Fifth graders participate in an online Web lesson plan on ways of interpreting data. They conduct a survey and interpret the results in a journal entry.
Curated OER
Bias in Statistics
Students work to develop surveys and collect data. They display the data using circle graphs, histograms, box and whisker plots, and scatter plots. Students use multimedia tools to develop a visual presentation to display their data.
Curated OER
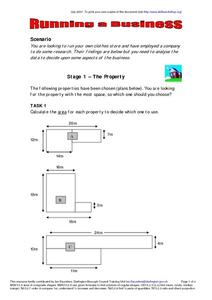
Running The Business
In this career activity, students are asked to look at the six stages necessary for the success of running a hypothetical new business.
Curated OER
Flying High in Math
Seventh graders study how real airplanes fly and then they construct models of paper airplanes using design resources for the Internet and their own design. They use meaurement and caluculations in order to help them construct their...
Curated OER
Descriptive Statistics
Students demonstrate how to use frequency and scatter diagrams. In this statistics lesson, students are introduced to different techniques of representing data. Students sort and graph data on a worksheet and use a frequency diagram to...
Better Lesson
Better Lesson: Analyze This! Mean Median Mode and Range
Finding measures of central tendency will be applied to the different graphs throughout this unit.
Education Development Center
Math Partners: Statistics and Probability [Pdf]
Comprehensive unit that consists of lessons and activities designed to help students learn statistics and probability concepts.
Other
Stat Soft: Statistics Glossary
Dozens of statistical terms are defined and illustrated in this glossary.


