Curated OER
Listen to Your Heart
Sixth graders explore how exercise affects heart rate and use spreadsheets to record and analyze data.
Curated OER
Using Computer for Statistical Analysis
Students examine the use for spreadsheets in analyzing data. They make spreadsheets that display and calculate a given data set such as temperature change.
Curated OER
Graphing Data - Temperature
Seventh graders measure and record temperature over a given time period. They compare the recorded temperatures to the 40-year recorded normal average temperatures for the same area. Students display and interpret their findings in a graph.
Curated OER
Monitoring Math with a Statistical Spreadsheet
Students use a spreadsheet to compute landmark statistics of a math
quiz. This instructional activity can be ongoing throughout the school year and it integrates mathematics curriculum and technology in a simple format for student use.
Curated OER
Weather for Health
Ninth graders encounter various types of numerical information (represented in multiple ways), much of which is abstract and difficult to comprehend. In this instructional activity, 9th graders will convert given information into bar...
Curated OER
Time For Breakfast
This unit encourages students to assess the validity of a set of statements and then plan and carry out investigations to find out whether the statements are true. Students then carry out statistical investigations of their own.
Curated OER
Measures of Spread
Students explore the concept of measures of spread. For this measures of spread lesson, students calculate the standard deviation for a set of data. Students use the standard deviation to analyze and describe the set of data. Students...
Curated OER
Measuring "pHacts" about Acid Rain
Sixth graders gather and graph information regarding the pH of rain. Working cooperatively with an internet partner, 6th graders gather and record information about the pH of the rain in their local area. They graph this information...
Curated OER
Raisin Cane
Students estimate and record the number of raisins in a snack-size box. They also graph their results and note the differences (+ or -) from their estimate and actual number.
Curated OER
Our Class Record Book
Second graders, in groups, prepare a list of proposed record ideas for the class book.
Curated OER
We Are Having a Party! Part II
Second graders, in groups, participate in a four-station rotation model to solve problems. They use coins and dice for stations one, two, and three.
Curated OER
We Are Having a Party! Part I
Second graders use data analysis skills in order to plan a class party. They graph possible times for the party noting the range for times. They discuss how mathematicians find and use the range to analyze data.
Curated OER
Chips Ahoy A Thousand Chips In Every Bag
Sixth graders determine whether Nabico's claim to sell 1000 chocolate chips in every 1 pound bag of Chips Ahoy! is true.
Curated OER
Looking at Data
Third graders use two days to create, collect, display and analyze data. Classroom activities and practice build greater understanding to a variety of forms used to display data.
Curated OER
Pi Digit Distribution
Students study graphing skills and compare and contrast data sets. They compute pi through the first 50-100 digits and create a bar graph showing the frequencies of specific digits.
Curated OER
Challenge: Agenian Ages-Statistics
In this statistics/data worksheet, students use given statistics of people from a fictional planet to answer 6 related questions.
Curated OER
Make and use a Stem-and-Leaf Plot
In this stem-and-leaf plot instructional activity, students use a given plot to solve 4 problems, then make a plot for given data and solve related problems. Houghton Mifflin text referenced.
Curated OER
Functioning as a Team
High schoolers work as a team to build a freestanding bridge from newspapers and masking tape and analyze the effectiveness of their group. In this teamwork lesson plan, students view and summarize a video on Service Learning Projects....
Curated OER
Statistics Newscast in Math Class
Young scholars study sports teams, gather data about the teams, and create a newscast about their data. In this sports analysis lesson, students research two teams and define their statistical data. Young scholars compare the two teams,...
Curated OER
The Fuelish Fact Finding
Students define fluctuation and the price of food. In this algebra lesson, students create a budget to live on based on their living expenses. They create a chart and explore the cause and effect of real life scenarios.
Curated OER
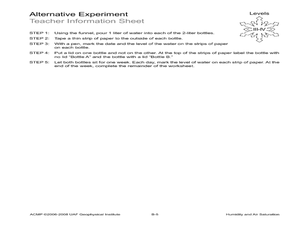
Humidity and Air Saturation
Students experiment with air saturation. In this earth science lesson, students first complete an activity which teaches humidity. Then they use the scientific method to create their own experiments to test how long it takes a...
Curated OER
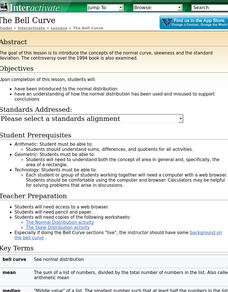
The Bell Curve
Students are introduced to the normal distribution and examine the bell curve controversy.
Other popular searches
- Graphing Mean, Median, Mode
- Free Mean, Median, Mode
- Math; Mean, Median, Mode
- Mean Median Mode Range
- Mean, Median, Mode Range
- Mean Mode Median
- Mean, Median, Mode, Range
- Mean Median Mode Lessons
- Mean, Median, Mode Unit
- Mean, Median, Mode M&m's
- Mean Median Mode and Range
- Mean, Median, Mode /Ohio


