Curated OER
"Colors" a poem by Shel Silverstein
Students collect data, graph it, and use the data to find measures of central tendencies, and find probabilities.
Curated OER
Statistical Analysis of Data by Gender
Students examine and identify gender bias, stereotyping, and discrimination in school materials, activities, and classroom instruction. They apply descriptive statistics knowledge to real-world data.
Curated OER
Being an Educated Consumer of Statistics
Students examine kinds of data used to report statistics, and create their own statistical report based on any of the four sources of media information (Internet, newspaper, TV, magazine).
Curated OER
Linear Patterns in Data
Eighth graders extend their learning of graphing linear equations and are introduced to connecting patterns in tables and graphs to represent algebraic representations. They then determine patterns and extrapolate information from these...
Curated OER
Perplexing Patterns
Seventh graders identify and find missing patterns. In this algebra lesson, 7th graders investigate numbers and sequences and complete the pattern. They make a chart and discuss similarities and differences.
Curated OER
The Dog Days of Data
Learners practice an alternative form of data presentation. They practice sequencing data, identifying the stem-and-leaf, creating stem-and-leaf plots, and drawing inferences from the data by viewing the plots.
Curated OER
The Dog Days of Data
Young scholars are introduced to the organization of data This lesson is designed using stem and leaf plots. After gather data, they create a visual representation of their data through the use of a stem and leaf plot. Students...
Curated OER
The Seasonal Round and The Cycle of Life
Fourth graders are introduced to the concept of the seasonal round and how folklife traditions vary from season to season. They begin charting dates of personal interest on seasonal round calendars by starting with birthdays. Students...
Curated OER
Design Team Challenge
Students work in groups to build a robot. In this robotics lesson plan, students create an electronic robot and program it to follow directions. They create an obstacle course for the robot to follow and test its performance.
Alabama Learning Exchange
The State Capital of Stem and Leaf
Students explore the concept of stem and leaf plots. In this stem and leaf plots lesson, students plot the 50 US states' capitals on a stem and leaf plot according to the first letter of each state. Students compare...
Curated OER
What I Didn't Know...
Learners practice creating wikis. In this wiki lesson, students create a wiki about any math topic that they know nothing about. Learners learn about their topic and create a wiki that explains the math topic in detail.
Curated OER
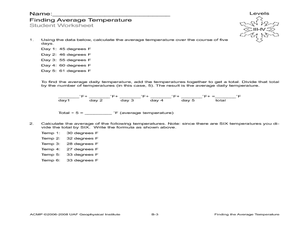
Finding the Average Temperature
Students calculate averages. In this average temperature lesson, students collect data and use their problem solving skills to calculate average temperatures.
Curated OER
Macbeth Madness
Students research Macbeth online and complete computer and graphing activities for the play. In this Macbeth activities instructional activity, students research Macbeth and bookmark the URL's. Students complete activities for the topic...
Illustrative Mathematics
Puppy Weights
Nobody can say no to puppies, so lets use them in math! Your learners will take puppy birth weights and organize them into different graphs. They can do a variety of different graphs and detail into the problem based on your classroom...
Curated OER
Probability: The Study of Chance
Students conduct an experiment, determine if a game is fair, and collect data. They interpret data, then display line graph. They conduct analysis of game for probability.
Curated OER
What's Up With My Class
Students collect data about their class and they use Excel spreadsheet to display their tables and graphs about the class. They answer survey questions and collect their data. Students create a graph of their choice to display the...
Alabama Learning Exchange
I Know What You Did Last Summer: A Data Graphing Project
Young scholars participate in graphing data. For this graphing data lesson, students make a stem and leaf plot of their summer activities. Young scholars create numerous graphs on poster boards. Students discuss the...
Curated OER
Why We Need Sleep
Fifth graders track how much sleep they get and list reasons sleep is important. In this health and math lesson, 5th graders keep up with their sleep times for a week and make notes about how they feel each day prior to the lesson. The...
Curated OER
How Many Animals?
Students use their math skills to develop estimates for the population of several animal species native to the Austrailian rainforest. It is a simulation that researchers at the Center for Rainforest Studies in Australia perform to...
Curated OER
Dealing with Data
Seventh graders collect and analyze data. In the seventh grade data analysis lesson, 7th graders explore and/or create frequency tables, multiple bar graphs, circle graphs, pictographs, histograms, line plots, stem and leaf plots,...
Curated OER
Academic Vocabulary: Sports Challenge
This PowerPoint enables students to review mathematical terms in an interactive review game format. The slides contain a question about a mathematical term and the students must answer with the correct vocabulary word in order to get...
Curated OER
How Far Can You Throw?
Sixth graders take a turn throwing the basketball and softball. They measure the distance in feet and inches between the starting and landing points of the balls. The recorder will record the distance each ball was thrown next to each...
Curated OER
Graph and Compare the Adventure's Temperature Vs. Local Temperature
Students explore the concept graphing data. In this graphing data lesson, students use weather data from their local weather and some other city and graph them. Students plot the local weather vs. another city. Students record...
Curated OER
Testing Weather Proverbs
Students study weather proverbs. In this weather lesson, students list weather proverbs and complete the worksheet to test the proverb. Students design an experiment to test the weather proverbs and conduct the experiments.
Other popular searches
- Graphing Mean, Median, Mode
- Free Mean, Median, Mode
- Math; Mean, Median, Mode
- Mean Median Mode Range
- Mean, Median, Mode Range
- Mean Mode Median
- Mean, Median, Mode, Range
- Mean Median Mode Lessons
- Mean, Median, Mode Unit
- Mean, Median, Mode M&m's
- Mean Median Mode and Range
- Mean, Median, Mode /Ohio


