Science Education Resource Center at Carleton College
Serc: Birds: How Do We Increase the Bird Population at Our School?
This is a lesson of how to improve our environment as well as how to enjoy it. The learners will sit in the schoolyard, study pictures of birds and then compile similarities and differences. Students will observe live birds in the yard...
Soft Schools
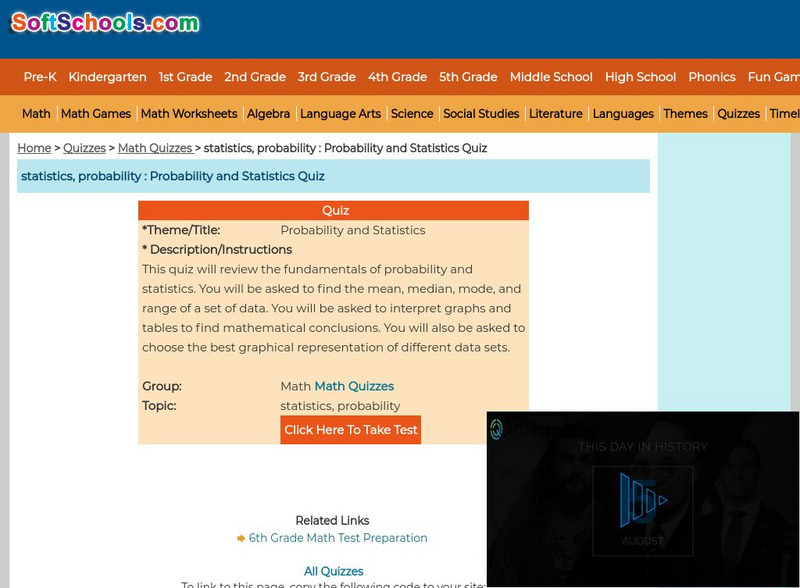
Soft Schools: Probability and Statistics Quiz
Students are asked to find the mean, median, mode, and range of a data set. Also, they must be able to interpret graphs and tables, and graphically represent data. The quiz is multiple choice and consists of nine questions, and a summary...
PBS
Pbs Learning Media: Restocking Shoes
In this video from Cyberchase, Bianca uses data on past shoe sales to help her decide what quantities of each size she should order in the next shipment.
That Quiz
That Quiz: Practice Test: Graphs
This resource allows users to test their knowledge of graphs and graphing methods.
Education Development Center
Math Partners: Statistics and Probability [Pdf]
Comprehensive unit that consists of lessons and activities designed to help students learn statistics and probability concepts.
University of Texas
Inside Mathematics: Baseball Players [Pdf]
This task challenges students to demonstrate understanding of the concept of measure of center.
CK-12 Foundation
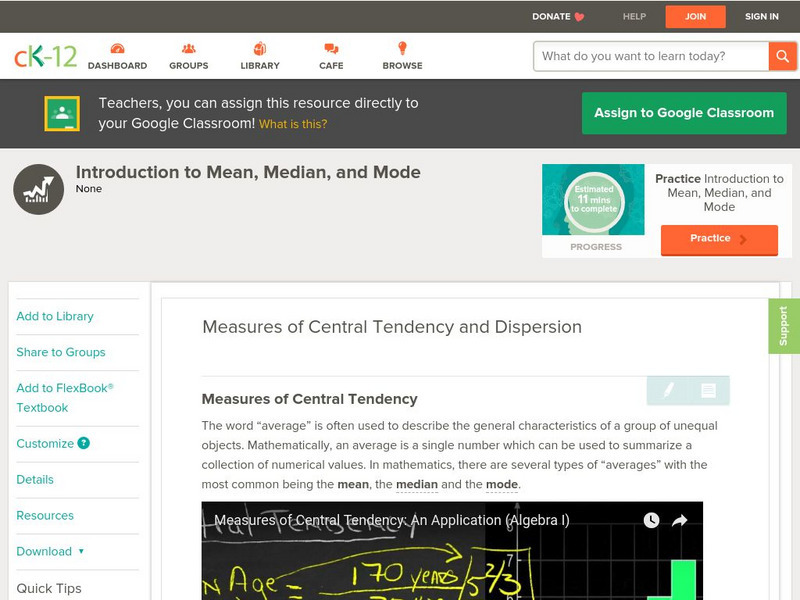
Ck 12: Measures of Central Tendency and Dispersion Grades 9 10
[Free Registration/Login may be required to access all resource tools.] Decide which measure of central tendency best describes a data set.
CK-12 Foundation
Ck 12: Measures of Central Tendency and Dispersion Grades 8 9
[Free Registration/Login may be required to access all resource tools.] Learn how to calculate different measures of central tendency, as well as the spread or dispersion of the data.
University of Illinois
University of Illinois: Data Types
The University of Illinois provides this site that is helpful because of the various kinds of data that can be collected. This lesson plan helps students differentiate between qualitative, quantitative, and many other types of data.
Science Education Resource Center at Carleton College
Serc: Nitrate Levels in the Rock Creek Park Watershed: Meas of Central Tendency
Activity uses water-quality data from Rock Creek Park to illustrate elementary statistical measures of exploratory data analysis. The focus of the lesson is the nutrient limitation in a stream and the three measures of central tendency.
Beacon Learning Center
Beacon Learning Center: All That Data 2
Students describe graphs and explore range, measures of central tendency, and distribution in this interactive web lesson.
Oswego City School District
Regents Exam Prep Center: Statistical Studies, Central Tendency, and Dispersion
The mathematics tutorial investigates statistical studies, central tendency, and dispersion. The lesson consists of class notes, calculator tips, examples, and practice problems with solutions. The teacher resource includes an activity...
BBC
Bbc Skillswise: Averages and Range
BBC Skillswise provides multiple factsheets, quizzes, activities, and worksheets on averages and variations.
Beacon Learning Center
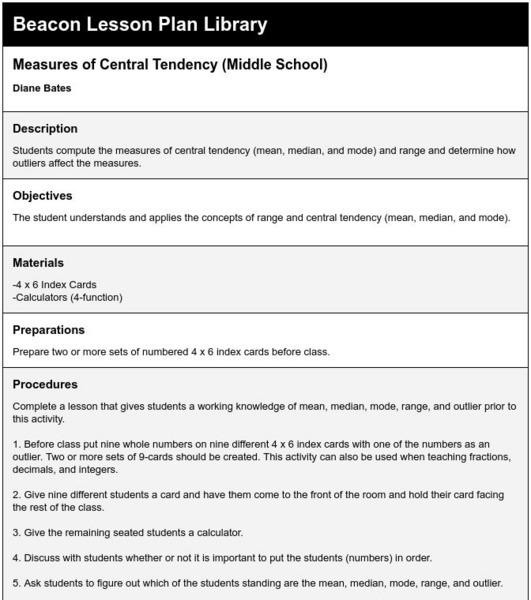
Beacon Learning Center: Measures of Central Tendency (Middle School)
Lesson plan provides practice for calculating measures of center.
Texas A&M University
Wtamu Virtual Math Lab: Beginning Agebra: Central Tendencies
A tutorial to understand the three central tendencies and how to find them, as well as the standard deviation of values. Offers a discussion and practice problems.
University of Illinois
University of Illinois: Measures of Central Tendency
This site provides valuable information regarding measures of central tendency. Also, clicking on the link gives valuable examples to clarify understanding.
Alabama Learning Exchange
Alex: "Ridin' Along in My Automobile"
Students will research prices of used cars to discover how automobiles lose their value over time. Students will create a chart to record their information, use their chart to graph their data, and find measures of central tendency of...
Better Lesson
Better Lesson: What Does the Data Tell Us? Describing Data
Understanding how to interpret data by its shape, spread, and center helps students to understand statistics.
Khan Academy
Khan Academy: Center and Spread Lesson
The resource from Khan Academy provides practice questions for the Praxis Core Math Test. This section reviews probability and statistics questions connected to the center and spread of data in a collection.
Shodor Education Foundation
Shodor Interactivate: Misleading Graphs
This lesson will challenge students to think creatively by having them design and build water balloon catchers from random scrap materials, while requiring them to take into consideration a multitude of variables including cost,...
E-learning for Kids
E Learning for Kids: Math: Olive Trees: Data & Chance
Ariel is taking a survey. Do you want to help her collect and describe data?
Other
American Youth Policy Forum: Thinking About Tests and Testing [Pdf]
A comprehensive primer in assessment literacy that seeks to raise awareness of key aspects about tests and testing issues. Explains essential statistical terms associated with testing (mean, modes, medians, distribution, dispersion,...
University of Wisconsin
University of Wisconsin: Measures of Central Tendency
This resource provides information about measures of central tendency.
Shodor Education Foundation
Shodor Interactivate: Lesson: Stem and Leaf Plots
Lesson plan introduces students to stem-and-leaf plots. Many resources are available for student and teachers here.
Other popular searches
- Graphing Mean, Median, Mode
- Free Mean, Median, Mode
- Math; Mean, Median, Mode
- Mean Median Mode Range
- Mean, Median, Mode Range
- Mean Mode Median
- Mean, Median, Mode, Range
- Mean Median Mode Lessons
- Mean, Median, Mode Unit
- Mean, Median, Mode M&m's
- Mean Median Mode and Range
- Mean, Median, Mode /Ohio


