Curated OER
My Peanut Butter is Better Than Yours!
Students explore the concept of statistical data. In this statistical data lesson, students read an article about the dangers of peanut butter to those who are allergic. Students perform a taste test of two different brands of peanut...
Curated OER
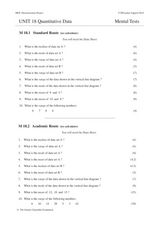
Unit 18 Quantitative Data
In this central tendency worksheet, students answer 30 short answer questions about data sets. Students find the median, mean, mode, and range of data sets.
Curated OER
What Does Average Look Like?
Fifth graders explore the concepts of range, median, mode, and mean through the use of graphs drawn from models. They use manipulatives to represent data they have collected within their groups, and compare the differences between mode,...
Curated OER
Exploring Online Data Analysis Tools Project Interactivate- Plop It
In this data analysis activity, students access an online data analysis tool at the given web site. They collect name length data for classmates and enter it into the tool. The find and manipulate the data to determine how the median is...
Curated OER
Central Tendency
In this central tendency learning exercise, 8th graders solve 10 different problems that include determining the mean, mode, and median of various situations. First, they prepare a frequency distribution with a class interval for the...
Curated OER
Mean, Median, Mode and Range Sheets
In this math worksheet, students use the graphic organizer to display their answers when learning about measures of central tendency. There are 4 boxes: mean, median, mode and range.
Curated OER
Word Problems That Involve the Mean
In this online worksheet, students solve 5 word problems. Each problem requires students to calculate for x.
Curated OER
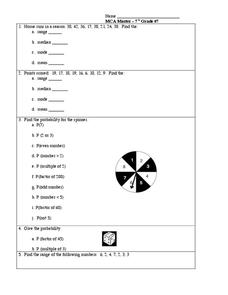
Probability and Statistics
In this probability and statistics activity, students complete 5 problems regarding range, mean, median, mode, and a spinner probability problem.
Curated OER
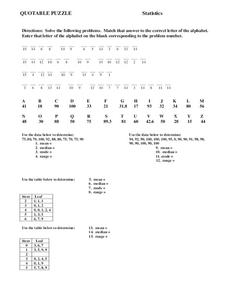
Statistics
In this statistics worksheet, 8th graders solve and complete 15 different problems. First, they solve each problem by using the data given to determine the mean, median, mode, and range for each set. Then, students match that answer to...
Curated OER
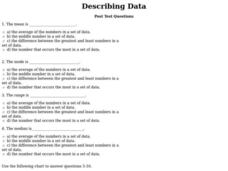
Describing Data
For this describing data worksheet, students answer multiple choice questions about mean, median, mode, and range. Students complete 10 questions total.
Curated OER
Statistics
In this statistics worksheet, 8th graders solve 4 problem sets related to an introduction to statistics. First, they find the range of each set of data. Then, students find the median and mode of each set of data. In addition, they...
Curated OER
Making Data Meaningful
In this sample mean worksheet, students explore different ways "average" is used. Students use this information to find the sample mean of the height of a large class of students. Students find the mean, median, mode and range of two...
Curated OER
Family Size
In this family size activity, students complete a tally chart to determine data from a family size line plot. They organize the data in the chart to determine the mean, median, mode, and range of the data. There are six problems in...
Curated OER
Measures of Central Tendencies: Quartiles
In this statistics worksheet, students calculate the mean, median, mode, range, lower quartile, and upper quartile for 10 questions and interpret a box and whiskers graph.
Curated OER
Average, Mode, and Median
For this average, mode and median worksheet, students learn how to determine each of these values and practice finding all three. They are given a table of different falcon flight speeds and they calculate the average, mode and median...
Curated OER
Find the Range #5
In this mathematics worksheet, students view 6 different sets of numbers. Students, for each set of numbers, find the mean, mode, median and range. Students place their answers in the boxes provided.
Math Mammoth
Stem-and-Leaf Plots 3
In this stem-and-leaf instructional activity, students place statistical data in a stem-and-leaf plot. They identify the median, and range in a given set of data. There are four multi-step problems on this one-page instructional activity.
Curated OER
Find the Range #1
In this mean, median, mode, and range learning exercise, students find the mean, median, mode, and range of a group of one digit numbers with numbers up to 9. Students complete 6 problems total.
Curated OER
Data Analysis
In this data analysis worksheet, students answer 4 questions using a weather report chart. Topics include mean, median, mode and range.
Curated OER
Data Analysis
In this data analysis worksheet, learners solve and complete 6 different problems that include using various types of data analysis. First, they create a stem-and-leaf plot of the ratios shown at the top and determine the mean, median,...
Curated OER
The Bell Curve
Learners are introduced to the concepts of the normal curve, skewness and the standard deviation. They discuss how the normal distribution has been used and misused to support conclusions.
Curated OER
Mean Absolute Deviation in Dot Plots
The lesson focuses on the ideas of dot plot representations and the mean absolute deviation of data sets.
Curated OER
M&Ms; Line Plots and Graphing
Students, using small individual bags of M&Ms, engage in activities including; estimating, sorting, graphing, mean, median, mode, fractions, percentage, and averaging.
Curated OER
Pick A Number
Elementary schoolers find out which month has the most class birthdays (mode) and which birthday represents the middle point of all the birthdays (median). They gather and organize data to find one number that fairly represents the whole...
Other popular searches
- Graphing Mean, Median, Mode
- Free Mean, Median, Mode
- Math; Mean, Median, Mode
- Mean Median Mode Range
- Mean, Median, Mode Range
- Mean Mode Median
- Mean, Median, Mode, Range
- Mean Median Mode Lessons
- Mean, Median, Mode Unit
- Mean, Median, Mode M&m's
- Mean Median Mode and Range
- Mean, Median, Mode /Ohio


