Noyce Foundation
Baseball Players
Baseball is all about statistics. Pupils solve problems related to mean, median, and range. They calculate the total weight of players given the mean weight, calculate the mean weight of reserve players given the mean weight of the...
Statistics Education Web
Walk the Line
How confident are you? Explore the meaning of a confidence interval using class collected data. Learners analyze data and follow the steps to determine a 95 percent confidence interval. They then interpret the meaning of the confidence...
Fort Bend Independent School District
Data Analysis - AP Statistics
What better way to study survey design than to design your own survey! Bring a versatile data analysis project to your AP Statistics class, and encourage them to apply the practices from their instructions to a real-world survey project.
101 Questions
Class Height Distribution
A picture is worth a thousand words, and this is no exception! The introductory photo shows a group of classmates lined up in height categories; females and males are in different colors, and the shape of the curve they create is...
Curated OER
A RealSim Surface Look at Descriptive Statistics
Students explore the concepts of mean and variance. They observe properties of materials to their basic atomic or molecular structure. Students use spreadsheet software to record, tabulate and analyze collected information.
EngageNY
Sampling Variability in the Sample Mean (part 1)
How accurate is data collected from a sample? Learners answer this question using a simulation to model data collected from a sample population. They analyze the data to understand the variability in the results.
College Board
2001 AP® Statistics Free-Response Questions
Develop a complete understanding of the course. Pupils and teachers use the six free-response questions to gather information about aspects of the AP® Statistics course. The resource and test section show how items cover the content. A...
College Board
2002 AP® Statistics Free-Response Questions
Statistically, prepared classes perform better. Teachers and pupils use the released 2002 AP® Statistics Free-Response questions to gain an understanding of how questions may be worded on the exam. Resources request that teachers put an...
Curated OER
Normal Curve Areas
In this normal curve areas learning exercise, students follow 6 steps to compute probability regarding possible sample means using a large sample. First, they label the scale with the mean and corresponding standard deviations. Then,...
Curated OER
Flipping for a Grade
What happens when your teachers get tired of grading tests and want to use games of chance to determine your grade? How would you decide which game they should play? Learn how to use expected value and standard notation to compare two...
Curated OER
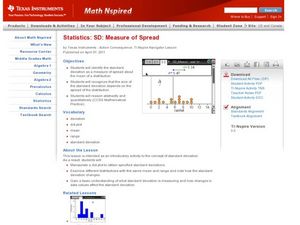
Measures of Spread
Students explore the concept of measures of spread. In this measures of spread lesson, students calculate the standard deviation for a set of data. Students use the standard deviation to analyze and describe the set of data. Students...
Curated OER
Data Analysis
Students examine techniques to represent data. In this data analysis lesson plan, students read about various ways to represent data, such as a stem and leaf diagram and calculating standard deviation. Students complete data analysis...
Curated OER
Basic Stats
In this chemistry worksheet, students focus upon the concepts of mean and standard deviation and how it is used in the laboratory to interpret data.
Illustrative Mathematics
Should We Send Out a Certificate?
Fred thinks his test score is high enough to earn him a certificate. Given the mean and standard deviation, use properties of normal distributions to calculate Fred's percentile ranking and see if he is right. Consider having your class...
American Statistical Association
Step into Statastics
Class members study the size of classmates' feet and perform a statistical analysis of their data. They solve for central tendencies, quartiles, and spread for the entire group as well as subgroups. They then write a conclusion based on...
Curated OER
Measure of Spread
Students identify the standard deviation. In this statistics lesson, students find the mean distribution and calculate the percent of deviation from the mean. They observe this change on the Ti calculator.
Curated OER
Geometry Review
In this math review learning exercise, students calculate the mean, median, mode, range, line segments, angles, and standard deviation for number and word problems. Students complete 11 problems.
Curated OER
Business & Statistics: Final Exam
For this business and statistics worksheet, students read real-life business problems, arrange data, and identify the probability method best used to determine the answer. They identify the type of random sample, draw stem-and-leaf...
Curated OER
Midterm 1 Exam: Statistics
In this statistics worksheet, students determine the mean, variance, standard deviation and median of given statistical data. They organize data, create box-and-whisker plots and identify outliers. This nine-page worksheet contains 7...
Virginia Department of Education
Normal Distributions
Pupils work to find probabilities by using areas under the normal curve. Groups work to calculate z-scores and solve real-world problems using the empirical rule or tables.
College Board
2010 AP® Statistics Free-Response Questions
Familiarity with the AP® exam is highly beneficial for test-takers. Scholars use the 2010 AP® Statistics free-response questions familiarize themselves with the test content and format. Studies and experiments, linear regression,...
Curated OER
Stem-and-Leaf Plots
In this stem-and-leaf plots worksheet, 9th graders solve and complete 9 various types of problems. First, they determine the mean, median, and mode of the stem-and-leaf plot shown. Then, students summarize the similarities and...
Inside Mathematics
Suzi's Company
The mean might not always be the best representation of the average. The assessment task has individuals determine the measures of center for the salaries of a company. They determine which of the three would be the best representation...
Howard Hughes Medical Institute
Sampling and Normal Distribution
Young scientists learn about sampling and normal distributions through data analysis. A worksheet guides them to better understanding and synthesis of knowledge.


