Virginia Department of Education
Organizing Topic: Data Analysis
Learners engage in six activities to lead them through the process of conducting a thorough analysis of data. Pupils work with calculating standard deviations and z-scores, finding the area under a normal curve, and sampling...
Virginia Department of Education
Exploring Statistics
Collect and analyze data to find out something interesting about classmates. Groups devise a statistical question and collect data from their group members. Individuals then create a display of their data and calculate descriptive...
Curated OER
Continuous Probability Distributions
In this continuous probability distribution activity, students identify discrete and continuous distributions. They calculate the linear combination of the independent normal random variable and determine probabilities using exponential...
Curated OER
Weather temperatures
Students investigate the given statistics about temperatures in cities around the nation in order to look for a pattern. They measure the mean, median, and mode for the data set of temperatures.
Curated OER
US Historical Climate: Excel Statistical
Students import US Historical Climate Network mean temperature data into Excel from a station of their choice. They are guided through the activity on how to use Excel for statistical calculations, graphing, and linear trend estimates.
Curated OER
4 Discrete Probability Distributions
Students read and complete problems on how to solve discrete probability distributions. In this probability distributions lesson plan, students read math problem examples and solve them.
Curated OER
Hypothesis Testing: Two Sample Tests
Students experiment and compare results of two populations. In this men and women populations lesson, students examine the difference in hand span for men and women. Students calculate a norm based on their...
Curated OER
Aesop's Fables (Grade 3)
Third graders develop a presentation based on Aesop's Fables. For this Aesop Fables and presentation lesson, 3rd graders examine the characteristics of fables and how to interpret them. They choose one of Aesop's Fables to research. They...
Curated OER
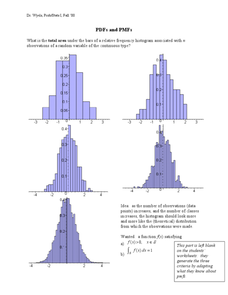
PDF's and PMF's
In this probability worksheet, learners solve for the area under the frequency histograms. They identify the area using the derivative. There are 3 questions.
Curated OER
Infusing Equity Gender into the Classroom
Students investigate if gender makes a difference in the classroom. In this statistics instructional activity, students collect data on whether equity by gender in the classroom makes students more successful.
Curated OER
Continuous Probability Distributions
Young scholars practice continuous probability distributions. In this probability lesson, students calculate probability, use probability functions, and use rectangular distribution.
Curated OER
Fair Games
Fifth graders examine the statistics of playing games. Many games of chance and activities in maths text books involve rolling two dice and combining the scores, usually by addition. Students often find the probabilities of such events...
Curated OER
Algebra 2/Trigonometry Regents Exam
Students review for the Regents Exam. In this math activity, students review core concept for the Regents exam by working a variety of problems. A printable worksheet is provided.
Curated OER
Statistical Analysis of Data by Gender
Students examine and identify gender bias, stereotyping, and discrimination in school materials, activities, and classroom instruction. They apply descriptive statistics knowledge to real-world data.
Curated OER
6 Poisson Distributions
Pupils explore the concept of poison distributions. In this poison distribution activity, students construct poison distributions by surveying the number of cars that pass a point in a specific amount of time. Pupils find poison...
Curated OER
Snowboarding! Join the U.S. Team: Olympics, Math, Weather
Young scholars make weather predictions and observations, research the cost of snowboarding equipment, and use their math skills to plot the course of a Giant Slalom Snowboarding event.
Texas Instruments
Texas Instruments: Means & Variances of Random Variables
This set contains statistics questions regarding means and variances of random variables. The student calculates sums and differences of random variables based on their means and variances.
Michigan Technological University
Computing Mean, Variance and Standard Deviation
Page centered around a computer program to determine mean, variance, and standard deviation.
Calculator Soup
Calculator Soup: Variance Calculator
Variance is a measure of dispersion of data points from the mean. Low variance indicates that data points are generally similar and do not vary widely from the mean. High variance indicates that data values have greater variability and...
Stefan Warner and Steven R. Costenoble
Finite Mathematics & Applied Calculus: Mean, Median & Standard Deviation
Students learn about mean, median, variance, and standard deviation. The tutorial investigates the statistics concepts though class notes and examples. Review exercises are included.
Other
Vlps: Mean and Standard Deviation
Explanation of frequency distributions, mean, standard deviations, and variance including a Java Applet.
Calculator Soup
Calculator Soup: Descriptive Statistics Calculator
This is a statistics calculator; enter a data set and hit calculate. Descriptive statistics summarize certain aspects of a data set or a population using numeric calculations. Examples of descriptive statistics include: mean, average,...
Texas Instruments
Texas Instruments: Binomial Distribution
Questions cover the binomial distribution. Students identify characteristics of a binomial distribution and calculate probabilities for different ranges. Binomial mean and variance are covered in the link between the binomial and normal...
Shodor Education Foundation
Shodor Interactivate: Measures
Enter data and view the mean, median, variance, and standard deviation of the data set.


