Interactive Mathematics
Interactive Mathematics: Poisson Distribution
Enter the world of Poisson Distributions. A brief background is given on the properties and applications of the concept. Examples are presented for calculating probabilities, mean and variance for situations that fit the conditions of...
Interactive Mathematics
Interactive Mathematics: Binomial Distribution
The definition and properties of binomial distributions are presented here, along with the formulas for finding the mean and variance. Examples are provided to demonstrate how binomial distribution problems are solved.
Missouri State University
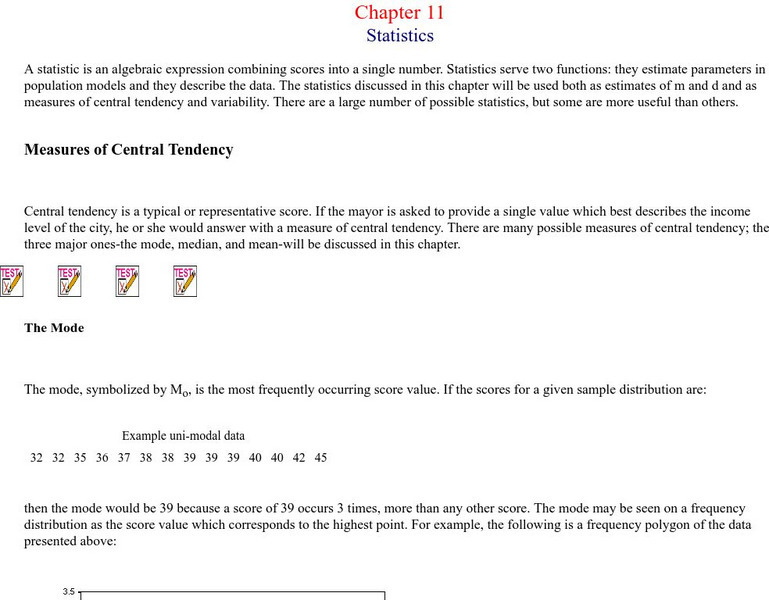
Missouri State University: Introductory Statistics: Statistics
This is an excellent resource on what the science of statistics involves. There are all kinds of definitions, examples, graphs, and charts to learn from. The topics covered include: mode, mean, median, skewed distributions and measures...
Missouri State University
Missouri State University: Introductory Statistics: The Normal Curve
Provides lengthy explanations of the measures of central tendencies - mean, mode, and median - and the measures of variability - range, variance, standard deviation - are given here. Graphs of interesting "side items" are presented as...
Missouri State University
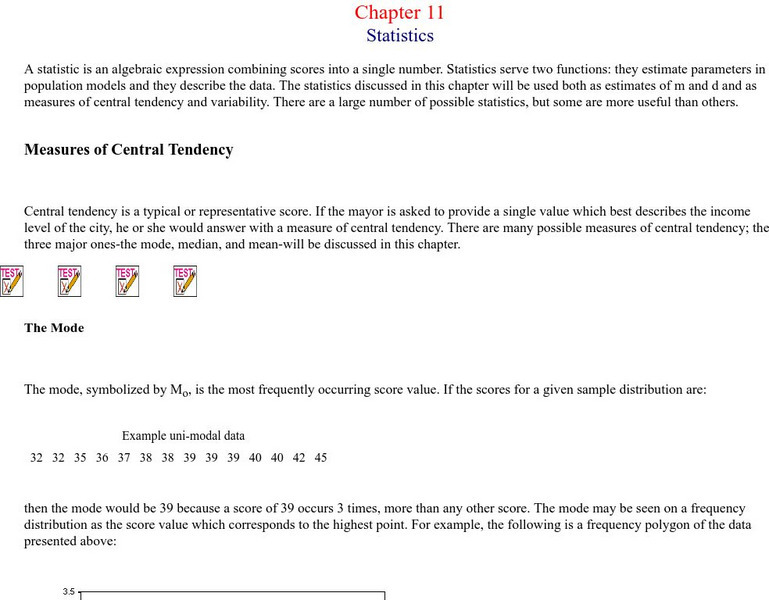
Missouri State U.: Statistics: Measures of Central Tendency and Variability
Provides lengthy explanations of the measures of central tendency - mean, mode, and median - and the measures of variability - range, variance, standard deviation. Graphs of interesting examples are presented as well, skewed...
Other
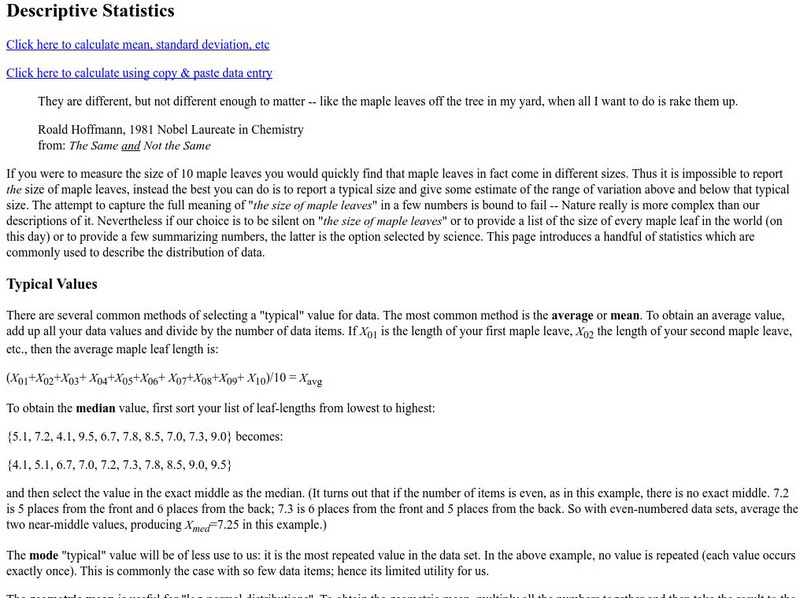
Descriptive Statistics
Very complete explanation of mean, standard deviation, etc. including an online calcluator for these statistics.
Curated OER
Computing Mean, Variance and Standard Deviation
Page centered around a computer program to determine mean, variance, and standard deviation.
Wolfram Research
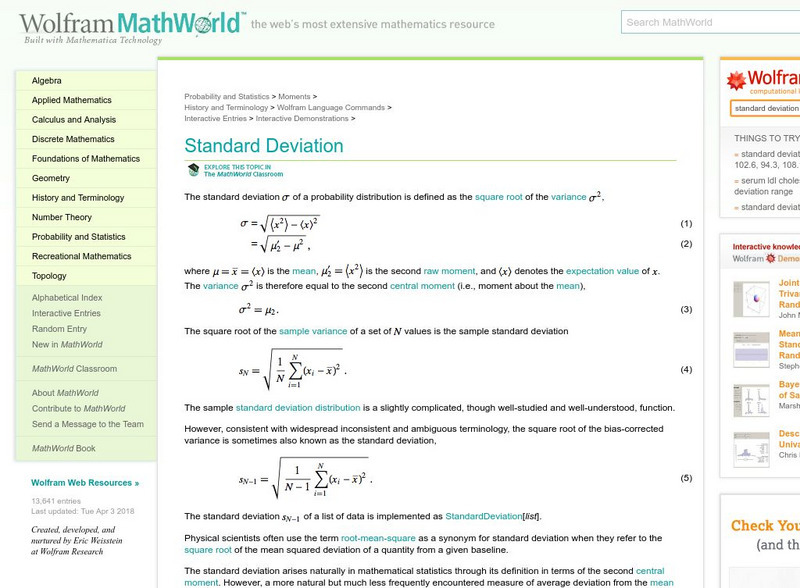
Wolfram Math World: Standard Deviation
This World of Mathematics site by Eric Weisstein explains the term "Standard deviation." Provides step-by-step help, examples, and charts.
Texas Instruments
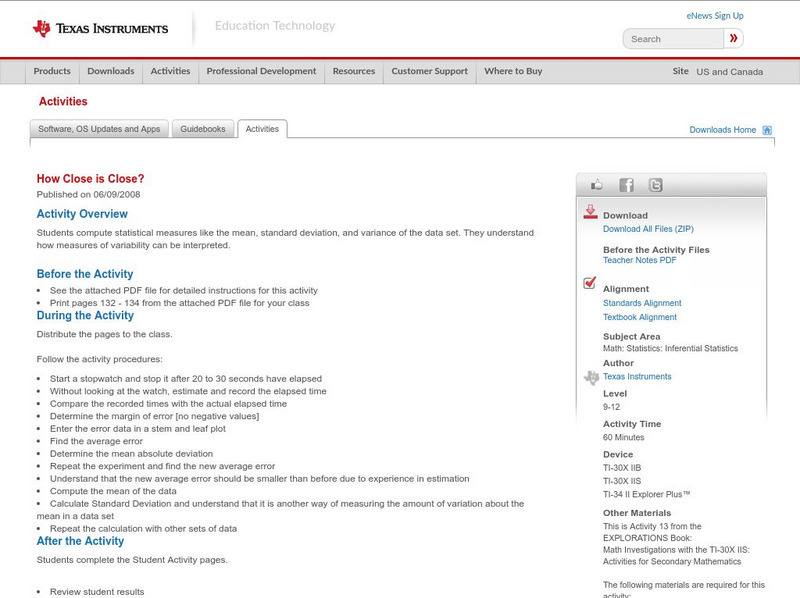
Texas Instruments: How Close Is Close?
In this activity, students compute statistical measures like the mean, standard deviation, and variance of the data set. They understand how measures of variability can be interpreted.
Other
Stat Soft: Statistics Glossary
Dozens of statistical terms are defined and illustrated in this glossary.
Other
Meta Calculator: Statistics Calculator
A web-based statistics calculator to find mean, median, standard deviation, variance and ranges.
Calculator Soup
Calculator Soup: Statistics Calculator
Calculate basic summary statistics for a sample or population data set including minimum, maximum, range, sum, count, mean, median, mode, standard deviation and variance.
Calculator Soup
Calculator Soup: Standard Deviation Calculator
Standard deviation is a statistical measure of diversity or variability in a data set. A low standard deviation indicates that data points are generally close to the mean or the average value. A high standard deviation indicates greater...
Other
Berrie's Statistics Page: Normal Distribution
Site discusses the normal distribution as well as the mean and variance in the normal distribution. A link is provided for a QuickTime activity to adjust the mean.
Oswego City School District
Regents Exam Prep Center: Statistical Studies, Central Tendency, and Dispersion
The mathematics tutorial investigates statistical studies, central tendency, and dispersion. The lesson consists of class notes, calculator tips, examples, and practice problems with solutions. The teacher resource includes an activity...
University of Illinois
University of Illinois: Introduction to Descriptive Statistics
A series of explanations of statistics terms based on the statistics from a dice game.


