Curated OER
The Great Heat Escape
Students observe a demonstration on the role of thermal conductivity in heat transfer. In this thermal conductivity lesson, students design and conduct an experiment to compare the thermal conductivity of four substances....
Curated OER
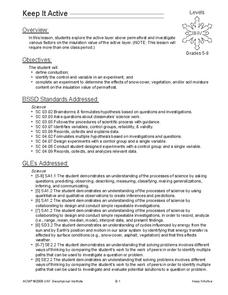
Keep it Active
Young scholars explore the active layer above permafrost and investigate various factors on the insulation value of the active layer. In this energy transfer activity, students conduct and experiment to determine the effects of...
Curated OER
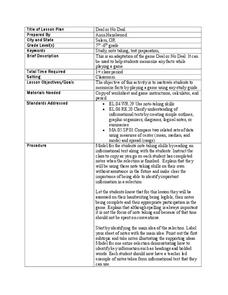
Deal or No Deal
Young scholars play a game in order to memorize any set of facts. In this memorization lesson plan, young scholars play an adaptation of the game Deal or No Deal to help them review and memorize factual information. Young scholars also...
Curated OER
Infusing Equity Gender into the Classroom
Young scholars investigate if gender makes a difference in the classroom. For this statistics lesson, students collect data on whether equity by gender in the classroom makes young scholars more successful.
Curated OER
The Spectrum of a Star
Tenth graders identify stars based on their line spectra. In this astronomy lesson, 10th graders analyze spectrograph and determine the elements present in the star. They explain the relationship between temperature and star classes.
Curated OER
Mathematics Module
Delve into graphing! The concepts covered begin with basic graphing basic coordinates and algebraic expressions on coordinate planes, and build up to graphing linear inequalities and equations. Learners solve and simplify various...
American Statistical Association
EllipSeeIt: Visualizing Strength and Direction of Correlation
Seeing is believing. Given several bivariate data sets, learners make scatter plots using the online SeeIt program to visualize the correlation. To get a more complete picture of the topic, they research their own data set and perform an...
American Statistical Association
Tell it Like it is!
Scholars apply prior knowledge of statistics to write a conclusion. They summarize using correct academic language and tell the story of the data.
Statistics Education Web
Sampling in Archaeology
Compare different random sampling types using an archaeological setting. Scholars collect data from an archaeological plot using simple random samples, stratified random samples, systematic random samples, and cluster random samples....
Curated OER
US Airports, Assessment Variation
Determining relationships is all part of algebra and functions. Your mathematicians will decide the type of relationship between airports and population and translate what the slope and y-intercept represent. The problem is multiple...
EngageNY
Summarizing Bivariate Categorical Data
How do you summarize data that cannot be averaged? Using an exploratory method, learners complete a two-way frequency table on super powers. The subject matter builds upon 8th grade knowledge of two-way tables.
Statistics Education Web
Consuming Cola
Caffeine affects your heart rate — or does it? Learners study experimental design while conducting their own experiment. They collect heart rate data after drinking a caffeinated beverage, create a box plot, and draw conclusions....
Statistics Education Web
Saga of Survival (Using Data about Donner Party to Illustrate Descriptive Statistics)
What did gender have to do with the survival rates of the Donner Party? Using comparative box plots, classes compare the ages of the survivors and nonsurvivors. Using the same method, individuals make conclusions about the...
Curated OER
Breakfast Cereal - How Nutritious Is Yours?
Middle schoolers analyze the nutritional value of breakfast cereal in order to make an informed choice. They create a stem and leaf plot which analyzes the nutritional value of the cereal they eat on a regular basis. Students write a...
Curated OER
Sampling Rocks
Students examine sampling by investigating rocks found in the schoolyard. For this sampling rocks lesson students collect and analyze a sample of rocks.
Curated OER
Using Computers to Produce Spreadsheets and Bar Graphs
Students review graphing terminology and how to plot data points, how to input data into a spreadsheet, and how to make a chart using a computer.
Curated OER
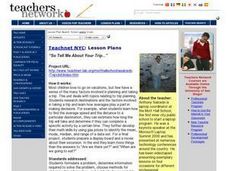
"So Tell Me About Your Trip..."
Students research destinations and the factors involved in taking a trip and explore how averages play a part in making decisions. They explore how to find the average speed and the distance to a particular destination, they estimate...
Curated OER
Functioning as a Team
Students work as a team to build a freestanding bridge from newspapers and masking tape and analyze the effectiveness of their group. In this teamwork lesson, students view and summarize a video on Service Learning Projects. Students...
Curated OER
Statistics Newscast in Math Class
Students study sports teams, gather data about the teams, and create a newscast about their data. In this sports analysis lesson, students research two teams and define their statistical data. Students compare the two teams, make...
Curated OER
Comparison of Two Different Gender Sports Teams - Part 1 of 3 Measures of Central Tendency
Students gather and analyze data from sports teams. For this measures of central tendency lesson, students gather information from websites about sports team performance. Students analyze and draw conclusions from this data. This lesson...
Curated OER
Scientific Method
Students explore the scientific method. In this scientific method lesson, students use information gathered from a "Seed Dispersal" lab done previously to complete a worksheet listing the steps of the scientific method.
Curated OER
The Fuelish Fact Finding
Students define fluctuation and the price of food. In this algebra lesson, students create a budget to live on based on their living expenses. They create a chart and explore the cause and effect of real life scenarios.
Curated OER
Box-and-Whisker
Seventh graders are introduced to the concept of box-and-whisker plots. A step-by-step process for creating a box-and-whisker plot is provided. The goal of the lesson is that students study the components of a box-and-whisker plot and be...
Curated OER
Student Heights
Students measure the heights of their fellow classmates and create a box and whisker plot to display the data. In this measurement lesson plan, students analyze the data and record results.
Other popular searches
- Mean, Median, Mode
- Mean Median Mode
- Graphing Mean, Median, Mode
- Free Mean, Median, Mode
- Math; Mean, Median, Mode
- Mean Median Mode Range
- Mean, Median, Mode Range
- Mean Median and Mode
- Median and Mean Statistics
- Mean, Median, Mode, Range
- Mean, Median and Mode
- Mean Median Mode Lessons


