Curated OER
Bell Curve
Students explore averages by completing a data analysis activity. In this bell curve lesson, students measure different food items and plot their measurements on a X and Y axis. Students create bell curves around the average weight or...
Curated OER
Statistics: Reading and interpreting production graphs
Students interpret and create different types of graphs. They analyze data from charts, develop a survey and design appropriate graphic illustrations and make a presentation.
Curated OER
Searching The Word
Fifth graders review EOG math terms and definitions found in their math notebooks, and pick between 15 and 20 words to put in a word search.
Curated OER
Box Plots on the TI-83 Calculator
Eighth graders research box plots on the Internet. They gather real life statistics and analyze the collected statistics by making multiple box plots on the TI-83 calculator.
Curated OER
Bias in Statistics
Students work to develop surveys and collect data. They display the data using circle graphs, histograms, box and whisker plots, and scatter plots. Students use multimedia tools to develop a visual presentation to display their data.
Curated OER
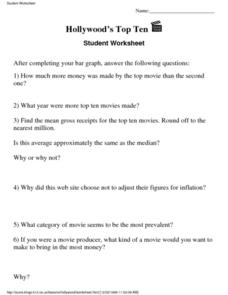
Hollywood’s Top Ten
In this entertainment worksheet, students answer 6 questions about their top ten favorite movies. The questions have no right answer because they are subjective.
Curated OER
The Statistics of M&Ms
Students explore the topic of statistics with M and Ms. In this math lesson plan, students use candy pieces to sort and gather information needed to create a bar graph. This lesson can be adapted to accommodate students in grades 1-12.
Curated OER
What Days Are the Busiest in the Maternity Ward?
Young scholars form a conclusion using statistical data. In this statistical data lesson, students collect and analysis data to form a conclusion about what day of the week most babies are born.
Curated OER
Feeling Crabby?
Students analyze data to investigate the influence of water depth on size among deep-water crabs. They interpret results from this data, and apply the results regarding appropriate fishery regulations.
Curated OER
Flying High in Math
Seventh graders study how real airplanes fly and then they construct models of paper airplanes using design resources for the Internet and their own design. They use meaurement and caluculations in order to help them construct their...
Curated OER
Shooting Stats
Eighth graders discover the important role statistics play in sports and that appropriate data must be collected to do a statistical analysis. Students practice calculating statistics by charting a professional player of their choice.
Curated OER
Using Statistics to Uncover More Evidence
Fifth graders participate in an online Web lesson plan on ways of interpreting data. They conduct a survey and interpret the results in a journal entry.
Curated OER
Closing the Case
Fifth graders collect data and prepare data displays using a survey with statistical information.
Curated OER
Home, Home in the City
Pupils create a spreadsheet that organizes housing information in the Houston area. They write a formula to determine the average price of homes in the Houston area.
Curated OER
"M&Ms"® Candies Worksheet 1
In this math worksheet, students find the likelihood of different outcomes with the use of M and M's candy for the seven questions and fill in the graphic organizer.
Curated OER
Vocabulary: Talking About the Weather-2
In this foreign language worksheet, students fill in the blanks for 10 weather related sentences. Each sentence has a list of three words to select from.
Curated OER
Descriptive Statistics
Young scholars demonstrate how to use frequency and scatter diagrams. In this statistics lesson plan, students are introduced to different techniques of representing data. Young scholars sort and graph data on a worksheet and use a...
Other
Sprk: Macro Lab Lesson 3 Mean, Median, & Mode: Teacher Guide [Pdf]
Learners will use Sphero to conduct an experiment. They will identify how long they need Sphero to move at 10% speed to reach and knock over a target object (such as a whiteboard marker). Using this information, they will then calculate...
Alabama Learning Exchange
Alex: The Mean, Median, and Mode Chain Gang
Cooperative learning groups and chain links are used to find the mean, median, and mode. A Science NetLinks instructional activity is linked for further real-life application in the world of baseball (optional). This lesson plan was...
Better Lesson
Better Lesson: Analyze This! Mean Median Mode and Range
Finding measures of central tendency will be applied to the different graphs throughout this unit.
Alabama Learning Exchange
Alex: Estimation Station
During this lesson, students will learn the difference between estimation and guessing. Knowing how to estimate is an essential skill that will help students determine approximate totals as well as check the reasonableness of their...
Science Education Resource Center at Carleton College
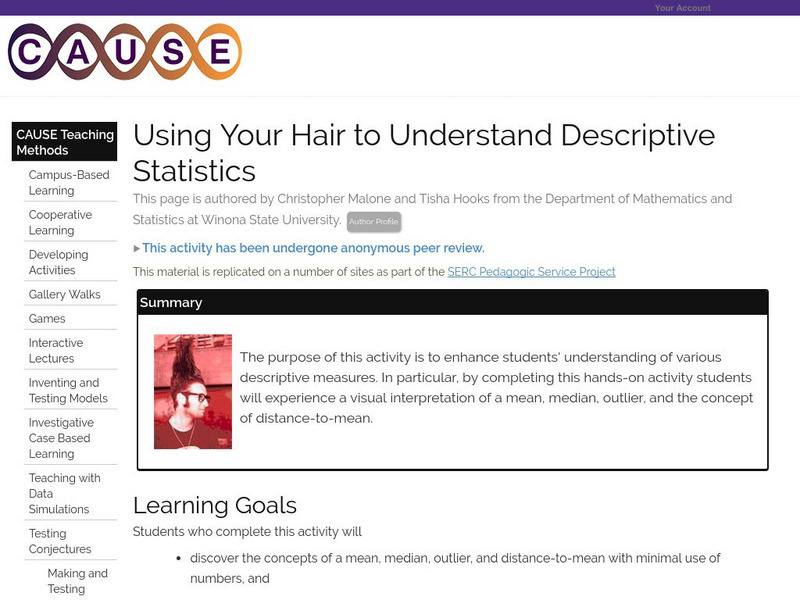
Serc: Using Your Hair to Understand Descriptive Statistics
Enhance students' understanding of various descriptive measures with a visual interpretation of a mean, median, outlier, and the concept of distance-to-mean.
Shodor Education Foundation
Shodor Interactivate: Lesson: Introduction to Statistics
"The goal of this lesson is to introduce the concepts of mean, median and mode and to develop understanding and familiarity with these ideas." This lesson is provided by Shodor Education Foundation.
Other
Raymond Geddes and Company, Inc.: Analyzing Product Price and Sales Data
Lesson plan provides a real-world application of mean, median, mode, and range.
Other popular searches
- Mean, Median, Mode
- Mean Median Mode
- Graphing Mean, Median, Mode
- Free Mean, Median, Mode
- Math; Mean, Median, Mode
- Mean Median Mode Range
- Mean, Median, Mode Range
- Mean Median and Mode
- Median and Mean Statistics
- Mean, Median, Mode, Range
- Mean, Median and Mode
- Mean Median Mode Lessons







![Sprk: Macro Lab Lesson 3 Mean, Median, & Mode: Teacher Guide [Pdf] Lesson Plan Sprk: Macro Lab Lesson 3 Mean, Median, & Mode: Teacher Guide [Pdf] Lesson Plan](https://d15y2dacu3jp90.cloudfront.net/images/attachment_defaults/resource/large/FPO-knovation.png)


