Curated OER
Maps and Modes, Finding a Mean Home on the Range
Fifth graders investigate data from maps to solve problems. In this data lesson, 5th graders study maps and collect data from each map. Students present their data in a variety of ways and calculate the mode, mean, median, and range.
Curated OER
Madley Brath #39 - Stem and Leaf Plots, Mean, Median, Mode and Range
For this measures of central tendency worksheet, students draw a stem and leaf plot of a set of test scores. They compute the mean, median, mode, and range of the data set, and round the answers to the nearest tenth.
Curated OER
Mean, Median, and Mode
Students calculate measures of central tendency. in this mean, median, and mode activity, students calculate the measures of central tendency. They organize data, examine and explain the statistics.
Curated OER
Data Analysis
Young statisticians use and interpret measures of center and spread such as mean, median, and mode as well as range. They use box plots to represent their data and answer questions regarding the correspondence between data sets and the...
Curated OER
Measures of Central Tendency Using Scientific Calculators
Learners explore mean, median, and mode as they model mathematics in real-world problem situations. The instructional activity requires the use of the TI 30X IIS.
Pace University
Grades 7-8 Mean, Median, and Mode
Take a central look at data. The differentiated lesson provides activities for pupils to calculate central tendencies. Scholars begin choosing three central tendency activities from a Tic-Tac-Toe board. Learners then choose from sports,...
Curated OER
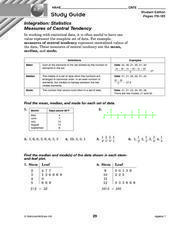
Integration: Statistics, Measures of Central Tendency
Learners find the mean, median, and mode for each of four data sets. They are given two line plots, and compute the median and mode of the shown data. They find the median and mode for three stem and leaf plots. They solve two word...
Curated OER
Applying Central Tendency
Twelfth graders calculate the mean, median, and mode of various wages. They apply these skills to asking for pay raises. They discuss whether the mean, median, or mode provide the highest wage increase.
Curated OER
Measures of Center
In this statistics worksheet, students find mean, median, and mode for 3 problems. They find the mean of summarized data in 2 problems.
Curated OER
Data Analysis: Graphs, Charts, Tables, Statistics
In this data analysis worksheet, students interpret data in 5 problems involving graphs, tables, and scatterplots. Students construct 1 stem and leaf plot and find the mean, median, and mode of a data set.
Curated OER
Mean Median and Mode
Young scholars collect data, graph it and analyze it. In this statistics lesson plan, students plot their data and calculate the mean, median and mode explaining how it relates to the data. They define the ways to find the mean, median...
Curated OER
Estimate and Compare Data
Seventh graders explore the values that are used in order to describe data that is collected or given. They compare data using the statistical analysis provided by finding the mean, median, and range.
Curated OER
Mean, Median, & Mode
Students determine mean, median, and mode. In this problem solving lesson, students evaluate a set of data to determine the mean, median, and mode. Students work in small groups practicing cooperative learning skills as they problem solve.
Curated OER
Mean, Median, and Mode
Fourth graders compare two sets of data by using a double bar graph. In this data analysis lesson, 4th graders study a double bar graph and complete questions based upon the data. Students construct a table to show the data from the...
Curated OER
China's Population Growth
Learners collect data from China's population growth and determine the mean, median, and mode from the data. In this data lesson plan, pupils determine probabilities and use them to make predictions.
Curated OER
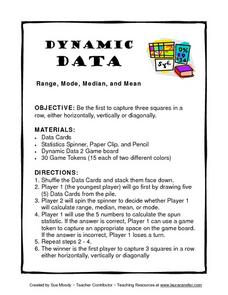
Dynamic Data Range, Mode, Median, and Mean
In this lesson, Dynamic Data Range, Mode, Median, and Mean, students play a game while figuring range, mode, median, and mean. Students spin for their task, figure the mode, mean, median or range of a row of numbers and gain a space on...
Curated OER
Range, Mean, Median, Mode
Students research the impact of craters. In this range, mean, median and mode activity, students complete an experiment with a marble to simulate the effects of a crater. Students collect and analyze data finding the range, mean, median...
Curated OER
Mean, Median, Mode and Range
Seventh graders identify the mean, mode, median and range in a given set of data. After playing "What's My Number" game, 7th graders brainstorm situations in which measurement of statistical data is important. They measure specified...
Curated OER
Drive the Data Derby
Three days of race car design and driving through the classroom while guessing probability could be a third graders dream. Learn to record car speed, distances traveled, and statistics by using calculation ranges using the mean, median,...
Curated OER
Mean, Median, Mode and Range
Sixth graders identify the mean, median, mode and range in a given set of data. Using a specified website, they use their skills to play the game, "Train Race" where students find the mean, median, and rage of information to help the...
Curated OER
Mean, Median, Mode and Range
In this math worksheet, students learn to find the mean, median, mode and range of a set of data. Students read the information and answer 5 questions in which they calculate mean, median, mode and range.
Curated OER
Using Mean, Median, Mode, and Range through Basketball
Eighth graders use the sports pages of the newspaper to analyze the mean, median, mode and range of basketball statistics.
Curated OER
Integration: Statistics
In this math worksheet, students find the mean, median and mode for 6 number sets. Students then find the median and mode for data found in 2 stem-and-leaf plots.
Curated OER
An "Average" Golf Score
Ninth graders investigate mean, median, and mode. For this mean, median, and mode lesson, 9th graders research gold data for the top ten scores in two golf tournaments. Students make tables and graphs of the data. ...
Other popular searches
- Graphing Mean, Median, Mode
- Free Mean, Median, Mode
- Math; Mean, Median, Mode
- Mean Median Mode Range
- Mean, Median, Mode Range
- Mean Mode Median
- Mean, Median, Mode, Range
- Mean Median Mode Lessons
- Mean, Median, Mode Unit
- Mean, Median, Mode M&m's
- Mean Median Mode and Range
- Mean, Median, Mode /Ohio


