Shodor Education Foundation
Shodor Interactivate: Skew Distribution
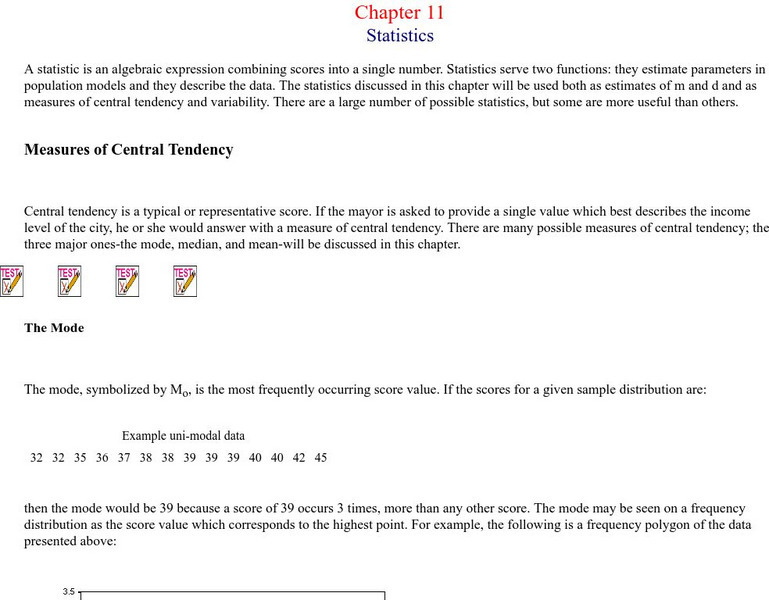
Change the median and standard deviation of an automatically generated normal distribution to create a skewed distribution, allowing you to observe properties like what it means for the mean, median, and mode to be different.
Texas Instruments
Texas Instruments: Measures of Central Tendency
Mean, median, and mode are measures of central tendency in data analysis. Each can be used to identify central tendency. Box-and-whiskers plots are a visual representation of collected data involving medians.
University of North Carolina
University of North Carolina Writing Center Handouts: Statistics
When presenting an argument, the use of statistics to support a point can be very effective. This handout offers advice on both how to read statistics so that you understand exactly what they mean, and how to use them in your argument so...
Concord Consortium
Seeing Math: Plop It
Plop It! lets you experiment with the concepts of mean, median, and mode (measures of center). You see the differences among them on a bar graph, as you add or remove blocks to an axis with a given range.
AAA Math
Aaa Math: Central Tendencies Notes
A complete description of mean, median and mode. Interactive games and practice exercises are included.
Other
Magoosh: Statistics Fundamentals
An online course on the fundamentals of statistics including video lessons in Mean, Median, and Mode; Weighted Averages; Quartiles and Boxplots; Range and Standard Deviation; Normal Distribution; Z-scores; Intro to Inferential...
Shodor Education Foundation
Shodor Interactivate: Plop It!
PlopIt allows users to build dot plots of data using the mouse. View how the mean, median, and mode change as entries are added to the plot.
PBS
Pbs Learning Media: Central Tendency: Targeted Math Instruction
At the end of this lesson, students will be able to recognize and apply the concepts of mean, median, and mode in real-life problems.
Texas Instruments
Texas Instruments: Data and Statistical Methods 1
In this set of exercises, a set of data is provided; students answer questions about mean, median, mode, and quartiles. Questions are multiple choice with solutions provided.
Alabama Learning Exchange
Alex: Estimation Station
During this lesson, students will learn the difference between estimation and guessing. Knowing how to estimate is an essential skill that will help students determine approximate totals as well as check the reasonableness of their...
Rice University
Hyper Stat Online Statistics Textbook: Central Tendency
Click on mean, median, mode, trimean, or trimmed mean to review central tendency.
Varsity Tutors
Varsity Tutors: Hotmath: Algebra Review: Mode, Mean and Median
Find a quick, concise explanation of a mode. An example is given and clearly explained. Mean and median are also explained.
Missouri State University
Missouri State University: Introductory Statistics: Statistics
This is an excellent resource on what the science of statistics involves. There are all kinds of definitions, examples, graphs, and charts to learn from. The topics covered include: mode, mean, median, skewed distributions and measures...
Math Drills
Math Drills: Statistics and Probability Worksheets
Download these free worksheets to sharpen your skills with statistics and probability. Sheets focus on collecting and organizing data, measures of central tendency (mean, median, mode, and range), and probability.
Mangahigh
Mangahigh: Data: Use the Range and Mode
This site provides students practice with the concept of range and mode. Students can learn about the topic by completing an interactive tutorial. Students can then take a ten question timed test to practice the skill.
BBC
Bbc: Ks2 Bitesize: Maths: Handling Data
This site provides games, quizes, and information about handling data, including mode, median, and mean.
Curated OER
Clip Art by Phillip Martin: Mean Median Mode Range
A clipart illustration by Phillip Martin titled "Mean Median Mode Range."
Palomar Community College District
Palomar College: Mode, Median, Mean Examples
A series of step-by-step worked problems demonstrating how to take a set of data and produce the measures of central tendency. Hints are provided along the way and the final measures are shown for the user to check.
CK-12 Foundation
Ck 12: Measures of Central Tendency and Dispersion Grade 8
[Free Registration/Login may be required to access all resource tools.] Find the mean, median, mode and range of a data set.
Scholastic
Scholastic: Study Jams! Math: Data Analysis: Mean Average
Students can watch a step by step lesson showing how to determine the mean. Then sing along with a song and test your knowledge of understanding when you have completed the activities.
ClassFlow
Class Flow: Statistics Landmarks Vote
[Free Registration/Login Required] This lesson uses clustering to explore the concept of mean, median, and mode of a set of data and calculates the arithmetic mean.
Other
James Wright: Measures of Central Tendency
This site looks at measures of central tendency and dispersion. Discussed are topics such as standard deviation, mean, median, and mode.
That Quiz
That Quiz: Medias
This interactive activity is designed as a review to the concept of mean, median and mode.
Texas Instruments
Texas Instruments: How Far to Your Birthplace
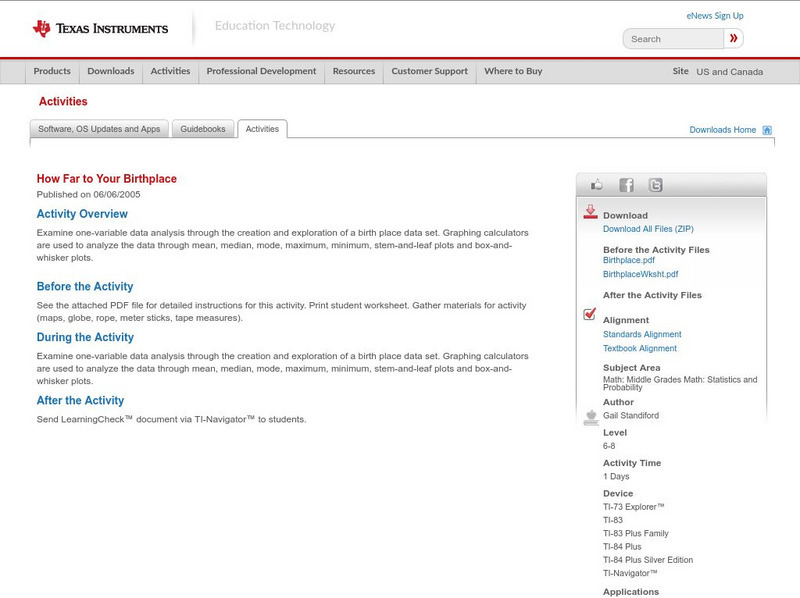
Examine one-variable data analysis through the creation and exploration of a birth place data set. Graphing calculators are used to analyze the data through mean, median, mode, maximum, minimum, stem-and-leaf plots and box-and-whisker...
Other popular searches
- Graphing Mean, Median, Mode
- Free Mean, Median, Mode
- Math; Mean, Median, Mode
- Mean Median Mode Range
- Mean, Median, Mode Range
- Mean Mode Median
- Mean, Median, Mode, Range
- Mean Median Mode Lessons
- Mean, Median, Mode Unit
- Mean, Median, Mode M&m's
- Mean Median Mode and Range
- Mean, Median, Mode /Ohio


