Scholastic
Study Jams! Median
Zoe is curious how many goals her soccer team usually scores in a game. To answer the question, she walks through the process of finding the median of a data set in this step-by-step presentation. Examples are included that model how to...
Scholastic
Study Jams! Mean/Average
Join Zoe as she calculates the average number of points RJ scored in his basketball games. This step-by-step presentation clearly models the procedure for finding the mean of a data set, including examples with both whole number and...
Curated OER
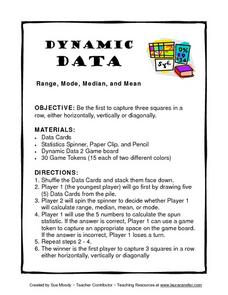
Dynamic Data Range, Mode, Median, and Mean
In this lesson, Dynamic Data Range, Mode, Median, and Mean, students play a game while figuring range, mode, median, and mean. Students spin for their task, figure the mode, mean, median or range of a row of numbers and gain a space on...
Curated OER
Range, Mean, Median, Mode
Students research the impact of craters. In this range, mean, median and mode lesson, students complete an experiment with a marble to simulate the effects of a crater. Students collect and analyze data finding the range, mean, median...
Curated OER
Mean, Median, Mode and Range
Seventh graders identify the mean, mode, median and range in a given set of data. After playing "What's My Number" game, 7th graders brainstorm situations in which measurement of statistical data is important. They measure specified...
Curated OER
Measures of Central Tendency
In this measures of central tendency activity, learners find the mean, median, and mode of 9 problems given different data sets. Students then solve 2 word problems.
Mathematics Assessment Project
Suzi's Company
Don't use an average resource ... use this one. As a middle school assessment task, learners first determine mean, median, and mode of salaries given in a frequency table. They then investigate how a change in one value changes the...
Curated OER
Drive the Data Derby
Three days of race car design and driving through the classroom while guessing probability could be a third graders dream. Learn to record car speed, distances traveled, and statistics by using calculation ranges using the mean, median,...
Shodor Education Foundation
Stem and Leaf Plotter
The key is in the leaves. Pupils enter data to create a stem-and-leaf plot. The resource then displays the plot and calculates the mean, median, and mode of the data. Using the plot and the calculated measures of spread, learners analyze...
Curated OER
Mean, Median, Mode and Range
Sixth graders identify the mean, median, mode and range in a given set of data. Using a specified website, they use their skills to play the game, "Train Race" where students find the mean, median, and rage of information to help the...
Curated OER
Mean, Median, Mode and Range
In this math worksheet, students learn to find the mean, median, mode and range of a set of data. Students read the information and answer 5 questions in which they calculate mean, median, mode and range.
Curated OER
Using Mean, Median, Mode, and Range through Basketball
Eighth graders use the sports pages of the newspaper to analyze the mean, median, mode and range of basketball statistics.
Teach Engineering
Earthquakes Living Lab: Locating Earthquakes
There are patterns in nearly everything — even earthquakes. Pairs research current earthquakes to see if there are any patterns. They determine the mean, median, and mode of the earthquake data, along with the maximum and...
CK-12 Foundation
Mode: Boxes of Oranges
See how your data stacks up. Pupils stack crates of oranges in increasing order, creating a simple bar graph. Using the graph, individuals determine measures of center and describe the shape of the distribution. Scholars determine what...
Curated OER
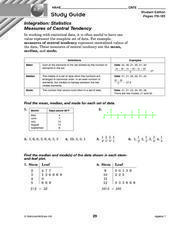
Integration: Statistics
In this math worksheet, students find the mean, median and mode for 6 number sets. Students then find the median and mode for data found in 2 stem-and-leaf plots.
Curated OER
An "Average" Golf Score
Ninth graders investigate mean, median, and mode. In this mean, median, and mode instructional activity, 9th graders research gold data for the top ten scores in two golf tournaments. Students make tables and graphs of the...
Curated OER
Global Warming Statistics
Students research and collect data regarding temperature changes for a specific location and find the mean, median, and mode for their data. In this climate change lesson, students choose a location to research and collect data regarding...
Curated OER
One, Two, Three...and They're Off
Students make origami frogs to race. After the race they measure the distance raced, collect the data, enter it into a chart. They then find the mean, median, and mode of the data. Next, students enter this data into Excel at which time...
Curated OER
Reaction Time
Students record reaction time data and calculate minimum, maximum, mean, median, and mode. They participate in a class reaction time activity, observe and conduct an online experiment, and discuss and analyze the activity results.
Curated OER
Find the Mean, Median, Mode & Range
In this math activity worksheet, students read groups of five to nine numbers and find their mean, median, mode, and range. Students solve 24 problems.
Curated OER
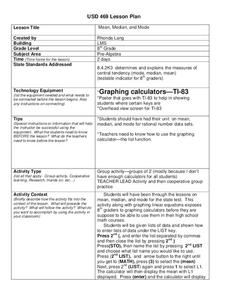
Mean, Median, and Mode
Eighth graders practice using the LIST key on graphing calculators using the proper syntax. They work with the functions of mean, median, and mode in a teacher led instructional activity and then with a partner on a second data set. They...
Curated OER
How Big Is Your Head?
Students explore measurement by measuring classmates' heads. They record their measurements and they put the measurements in order from smallest to largest. Students figure the mean, median, mode, maximum, minimum, and range of their...
Curated OER
Determining Mean, Range, Median, Mode, and Probability
Students calculate mean, median, range, mode and probability. Then, working in teams, they use data from their workplace to compute values for these terms. Finally the class explores the term "probability" using a die.
Curated OER
Finding Mean, Mode and Median in the Computer Lab
Learners create spreadsheets which will display and figure mean, median, and mode of a set of numbers.
Other popular searches
- Graphing Mean, Median, Mode
- Free Mean, Median, Mode
- Math; Mean, Median, Mode
- Mean Median Mode Range
- Mean, Median, Mode Range
- Mean Mode Median
- Mean, Median, Mode, Range
- Mean Median Mode Lessons
- Mean, Median, Mode Unit
- Mean, Median, Mode M&m's
- Mean Median Mode and Range
- Mean, Median, Mode /Ohio


