Shmoop
Box, Stem-Leaf, and Histogram
A helpful and versatile worksheet requires young mathematicians to analyze data in order to create graphs and answer questions. Additionally, it prompts learners to find the mean, median, mode, and range of some of the data sets.
Curriculum Corner
Measures of Central Tendency
Reinforce the concept of central tendency—mean, median, mode, and range—with a practice packet that comprises of eight problems and a structured answer sheet with plenty of room to show work.
Curated OER
Find the Range #5
For this mathematics worksheet, students view 6 different sets of numbers. Students, for each set of numbers, find the mean, mode, median and range. Students place their answers in the boxes provided.
Curated OER
Beyond Averages: Median, Mode and Range
In this median, mode and range activity, students complete a set of 10 multiple choice questions, clicking on an answer link to view correct answers.
Curated OER
Mean, Median, Mode and Range Sheets
In this math worksheet, students use the graphic organizer to display their answers when learning about measures of central tendency. There are 4 boxes: mean, median, mode and range.
Curated OER
Find the Range #1
In this mean, median, mode, and range worksheet, students find the mean, median, mode, and range of a group of one digit numbers with numbers up to 9. Students complete 6 problems total.
Curated OER
Mean, Median, Mode, and Range: Practice
In this line plots learning exercise, students make a line plot for each set of data and identify any clusters or gaps. Students then find the mean, median, mode, and range for the first four problems. Students then find n using the...
Curated OER
Probability and Statistics
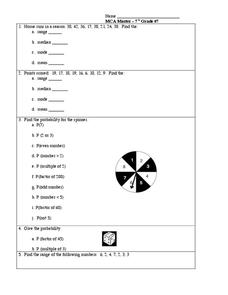
In this probability and statistics worksheet, students complete 5 problems regarding range, mean, median, mode, and a spinner probability problem.
Curated OER
Measures of Central Tendencies: Quartiles
In this statistics worksheet, students calculate the mean, median, mode, range, lower quartile, and upper quartile for 10 questions and interpret a box and whiskers graph.
Curated OER
Statistics - Central Tendency
In this statistics worksheet, students solve and complete 13 different problems that include creating various box-and-whisker plots. First, they write a definition for mean, median, mode and range. Then students explain how to determine...
Curated OER
Mean, Median, and Mode 1
For this mean, median and mode worksheet, learners use the measures of central tendency to describe given statistical data. Students identify the range of data, and match data to its representative bar graph. Two multi-step problems...
Curated OER
Statistics
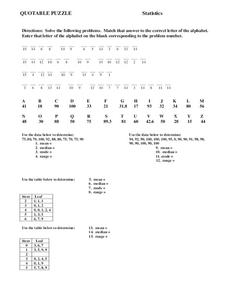
In this statistics worksheet, 8th graders solve and complete 15 different problems. First, they solve each problem by using the data given to determine the mean, median, mode, and range for each set. Then, students match that answer to...
Curated OER
Using Averages
In this math worksheet, pupils compute the range, mean, median and modal weight of candy bars from two machines. Students write a short essay about which machine is using too much chocolate and which is more reliable.
Curated OER
Describing Data
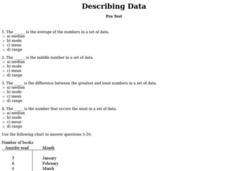
For this data worksheet, students complete multiple choice questions about mean, median, mode, and range. Students complete 10 questions total.
Curated OER
Describing Data
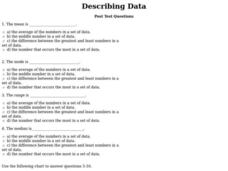
In this describing data worksheet, students answer multiple choice questions about mean, median, mode, and range. Students complete 10 questions total.
Curated OER
Family Size
In this family size worksheet, students complete a tally chart to determine data from a family size line plot. They organize the data in the chart to determine the mean, median, mode, and range of the data. There are six problems in...
Curated OER
Making Data Meaningful
In this sample mean worksheet, students explore different ways "average" is used. Kids use this information to find the sample mean of the height of a large class of students. Students find the mean, median, mode and range of two sets of...
Curated OER
Density of a Paper Clip Lab Review
Even though this assignment is brought to you by Physics Lab Online, it is best used as a math practice. Middle schoolers calculate the range, mean, mode, and median for a list of eight different paper clip densities. They analyze...
Noyce Foundation
Baseball Players
Baseball is all about statistics. Pupils solve problems related to mean, median, and range. They calculate the total weight of players given the mean weight, calculate the mean weight of reserve players given the mean weight of the...
Georgia Department of Education
Math Class
Young analysts use real (provided) data from a class's test scores to practice using statistical tools. Not only do learners calculate measures of center and spread (including mean, median, deviation, and IQ range), but...
Curated OER
Data Analysis
In this data analysis worksheet, students answer 4 questions using a weather report chart. Topics include mean, median, mode and range.
Curated OER
Unit 18 Quantitative Data
In this central tendency worksheet, students answer 30 short answer questions about data sets. Students find the median, mean, mode, and range of data sets.
Curated OER
Statistics
In this statistics instructional activity, 7th graders solve and complete 5 different problems related to determining various statistics. First, they find the average of a given set of numbers. Then, students find the median and mode of...
Curated OER
Geometry Review
In this math review worksheet, students calculate the mean, median, mode, range, line segments, angles, and standard deviation for number and word problems. Students complete 11 problems.
Other popular searches
- Range, Mean, Median, Mode
- Range Mean Median Mode
- Mode, Range, Mean, Median
- Range, Median, Mode, Mean


