American Statistical Association
Tell it Like it is!
Scholars apply prior knowledge of statistics to write a conclusion. They summarize using correct academic language and tell the story of the data.
Curated OER
How Many Animals?
Students use their math skills to develop estimates for the population of several animal species native to the Austrailian rainforest. It is a simulation that researchers at the Center for Rainforest Studies in Australia perform to...
Curated OER
The Guise of a Graph Gumshoe
Eighth graders practice constructing bar, circle, and box-and-whisker graphs. They practice reading and interpreting data displays and explore how different displays of data can lead to different interpretations.
Curated OER
Word Power
Fifth graders identify a set of data from a real world problem. In this statistics lesson, 5th graders identify the range, mode, median and mean using some manipulatives. They write words randomizing the letters.
Curated OER
Questioning NASA
Space science and math collide in this inquiry that investigates launching times for antacid-tablet rockets! Upper elementary or middle school learners collect data as they launch these mini rockets. They apply concepts of place value...
Curated OER
Observation Milk Fat Lesson
Turn your class loose to experiment with the different fat content in skim milk, whole milk, half and half, and heavy cream. This is a visually vibrant experiment, as learners drip food coloring on the surface of the products and measure...
Curated OER
Math: Giant Alaskan Cabbages
Students analyze data from the Alaska State Fair's "Giant Cabbage Weigh-Off." Once they have sorted the weights, they calculate the range, mean, mode, and median of the cabbages. Finally, students create posters displaying their...
Curated OER
Probability and Statistics - Week 10
In this probability and statistics worksheet, learners find compound dependent and independent probability of given situations. They identify the mean, mode, range and median of sets. This two-page worksheet contains explanations,...
Curated OER
Skittles® in the Middle
Fourth graders work in small groups, using bags of Skittles?? to determine the mean of one color of Skittles?? found in each bag, in each group, and in the entire class. This is a good lesson to help motivate students to explore mode,...
Curated OER
We Are Having a Party! Part I
Second graders use data analysis skills in order to plan a class party. They graph possible times for the party noting the range for times. They discuss how mathematicians find and use the range to analyze data.
Curated OER
Introduction to Representing and Analyzing Data
Represent data graphically. Allow your class to explore different methods of representing data. They create foldables, sing songs, and play a dice game to reinforce the measures of central tendency.
Curated OER
How's The Weather?
Students make a box and whiskers plot using the TI-73 graphing calculator. Each student would have their own calculator but they would work in small groups of two or three to help each other enter the data and make the plots.
Curated OER
Interpreting and Displaying Sets of Data
Students explore the concept of interpreting data. For this interpreting data lesson, students make a line plot of themselves according to the number of cubes they can hold in their hand. Students create their own data to graph and...
Curated OER
Height versus Shoe Size
Middle schoolers find a correlation between a person's height and his/her shoe size. They have access to entering data into lists on a graphing calculator and can complete scatter plots. Students read and interpret a scatter plot and use...
Curated OER
Beary O'Mometer Learns About Careers In Meteorology
Students explore the field of meteorology. In this meteorology lesson, students explore weather-related careers as they research the field of study as well as various weather concepts. Students interview meteorologists, write business...
Curated OER
How Oceans Affect Climate
Students draw conclusions about how the ocean affects temperature. In this weather lesson, students use the Internet to gather data to help them come to a conclusion about how the climate in a certain region is directly affected by the...
Curated OER
Great Graphing
Students collect data, use a computer spreadsheet program to create various graphs, and compare the graphs. They state the findings of each graph in writing and decide which graph type best represents the data.
Curated OER
Polystyrene Containers
Students conduct experiments to determine the effectiveness of polystyrene containers at preventing heat loss. In this polymers instructional activity, students design an experiment to determine how effective Styrofoam burger containers...
Curated OER
Flipping For Math
Seventh graders create a video of different formats to deliver a presentation of a math concept such as square roots, decimals, fractions, and more. In this math presentation lesson plan, 7th graders can plan a rap video, story,...
Curated OER
Raisin the Statistical Roof
Use a box of raisins to help introduce the concept of data analysis. Learners collect, analyze and display their data using a variety of methods. The included worksheet takes them through a step-by-step analysis process and graphing.
Curated OER
Functioning as a Team
High schoolers work as a team to build a freestanding bridge from newspapers and masking tape and analyze the effectiveness of their group. In this teamwork lesson plan, students view and summarize a video on Service Learning Projects....
Curated OER
Statistics Newscast in Math Class
Young scholars study sports teams, gather data about the teams, and create a newscast about their data. In this sports analysis lesson, students research two teams and define their statistical data. Young scholars compare the two teams,...
Curated OER
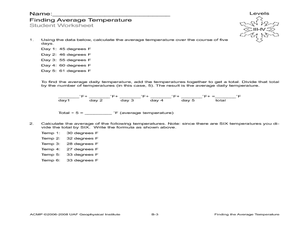
Finding the Average Temperature
Students calculate averages. In this average temperature activity, students collect data and use their problem solving skills to calculate average temperatures.
Curated OER
Perplexing Patterns
Seventh graders identify and find missing patterns. For this algebra lesson, 7th graders investigate numbers and sequences and complete the pattern. They make a chart and discuss similarities and differences.
Other popular searches
- Range, Mean, Median, Mode
- Range Mean Median Mode
- Mode, Range, Mean, Median
- Range, Median, Mode, Mean


